The HistogramViewEnum type specifies the items
being included in the histogram. Use the
HistogramView
property to specify the items or bars being displayed in the histogram. The HistogramViewEnum type
supports the following values:
| | Name | Value | Description | |
| |
exHistogramVisibleItems | 1
|
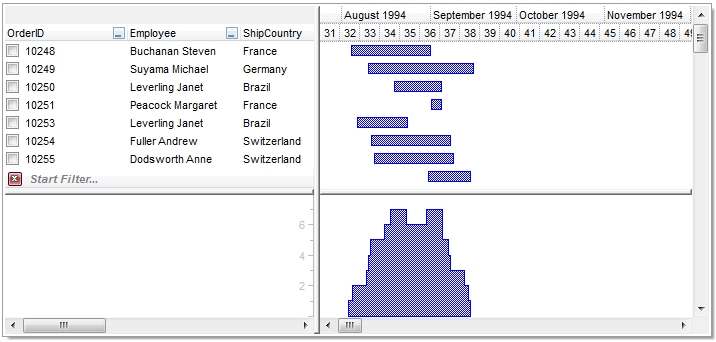
The histogram is shown for the visible items only. The Histogram is updated as
soon as the control changes its first visible item ( FirstVisibleItem,
NextVisibleItem and IsItemVisible properties determines the items
to be included in the histogram ), in other words the control
gets vertically scrolled. This flag can be combined
with
- exHistogramLeafItems
- exHistogramRecLeafItems
- exHistogramNoGrouping
| |
| |
exHistogramSelectedItems | 2
|
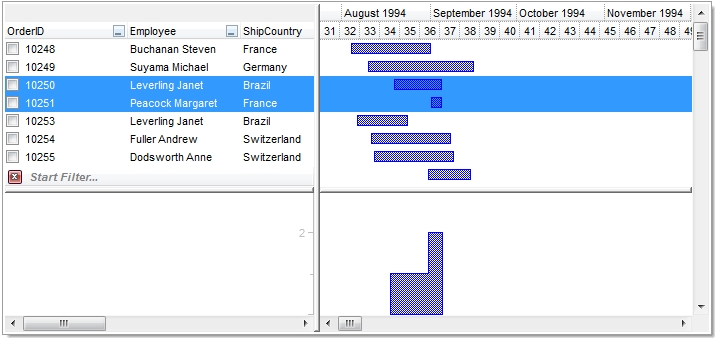
The histogram is shown for the selected items only ( SelectCount,
SelectedItem property determines the items
to be shown in the chart's histogram ). Use the SingleSel
property to specify whether the control can select multiple items. Use the SelectOnClick property to disable
selecting new items when the user clicks the chart area. The Histogram is updated as
soon as the selection is changed. This flag can be combined
with:
- exHistogramLeafItems
- exHistogramRecLeafItems
- exHistogramNoGrouping
| |
| |
exHistogramCheckedItems | 4
|
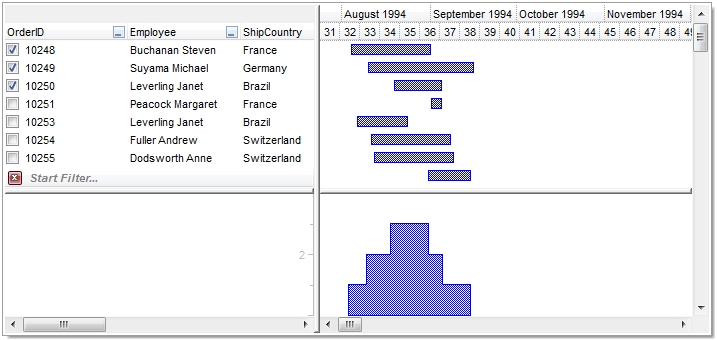
The histogram is shown for the checked items only. You must combine this with
exHistogramUnlockedItems,
exHistogramLockedTopItems or exHistogramLockedBottomItems. The CellState
property specifies the state of the cell / item. The histogram includes only items
that have the CellState property on 1 ( locked and unlocked items ). By default,
the check box should be on the first column ( the column with the index 0 ). Use
the high word of the HistogramView property to specify a different column. For
instance, if you need to display the histogram based on the check boxes of the
column index 5, the HistogramView property should be 0x50000 +
exHistogramCheckedItems +
exHistogramUnlockedItems. Another sample, if the HistogramView property is
exHistogramCheckedItems +
exHistogramLockedBottomItems the histogram shows only the checked items in the
bottom locked area. The Histogram is updated as soon as the user changes
the state of the cell's check box. This flag can be combined with:
- exHistogramLeafItems
- exHistogramRecLeafItems
- exHistogramNoGrouping
| |
| |
exHistogramFilteredItems | 128
|
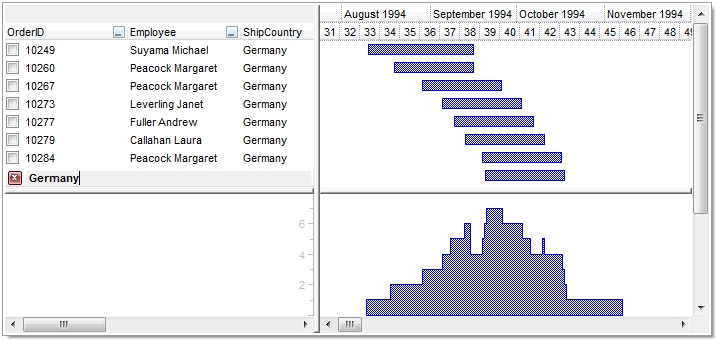
The histogram is shown for the filtered items only. The Histogram is updated as
soon as the user changes the control's filter. This flag can be combined
with:
- exHistogramLeafItems
- exHistogramRecLeafItems
- exHistogramNoGrouping
| |
| |
exHistogramSelectedBars | 8
|
The histogram is shown for the selected bars only. The ItemBar(exBarSelected)
property specifies whether a bar is selected or unselected. The ChartSelectionChanged
event notifies the application once a new bar is selected or unselected.
| |
| |
exHistogramUnlockedItems | 16
|
The histogram is shown only for unlocked items. Use the AddItem/InsertItem
methods to add unlocked items. This option can be combined with
exHistogramCheckedItems,
exHistogramLockedTopItems or
exHistogramLockedBottomItems. For instance, if the HistogramView property is
exHistogramUnlockedItems +
exHistogramLockedTopItems the histogram shows all the items in the
unlocked plus the items in the top locked area.
| |
| |
exHistogramLockedTopItems | 32
|
The histogram is shown only for locked items in the top side of the control.
Use the LockedItemCount property to
specify how many items are in the locked area. This option can be combined with
exHistogramCheckedItems, exHistogramUnlockedItems or
exHistogramLockedBottomItems. For instance, if the HistogramView property is
exHistogramUnlockedItems +
exHistogramLockedTopItems the histogram shows all the items in the
unlocked plus the items in the top locked area.
| |
| |
exHistogramLockedBottomItems | 64
|
The histogram is shown only for locked items in the bottom side of the control.
Use the LockedItemCount property to
specify how many items are in the locked area. This option can be combined with
exHistogramCheckedItems, exHistogramUnlockedItems or exHistogramLockedTopItems. For
instance, if the HistogramView property is exHistogramUnlockedItems +
exHistogramLockedBottomItems the histogram shows all the items in the
unlocked plus the items in the bottom locked area.
| |
| |
exHistogramAllItems | 112
|
The histogram is shown for all items, locked and unlocked items too. The
exHistogramAllItems is a shortcut for the
exHistogramUnlockedItems +
exHistogramLockedTopItems +
exHistogramLockedBottomItems. This flag can be combined with:
- exHistogramLeafItems
- exHistogramRecLeafItems
- exHistogramNoGrouping
| |
| |
exHistogramLeafItems | 256
|
The histogram shows the bars for leaf items, in other words, the item itself if contains no child items, or all child items that contains no other child items. Use
this flag to include in the histogram the bars in the child items too.
| |
| |
exHistogramRecLeafItems | 512
|
The histogram shows all bars for all recursive leaf items, so all child leaf items are displayed.
Use this flag to include in the histogram the bars in all child items ( recursively
) too.
| |
| |
exHistogramNoGrouping | 1024
|
(exHistogramNoGrouping/1024) If present, the histogram shows all bars without grouping based on the item's
parent, and so all bars shares the same space for the histogram. If missing,
the bars included in the histogram are grouped based on their parents, and each
group has allocated a space in the histogram, so each group is shown separately. The
exHistogramNoGrouping flag can not be combined with
exHistogramNoGroupCaption or
exHistogramGroupCumulative flag.
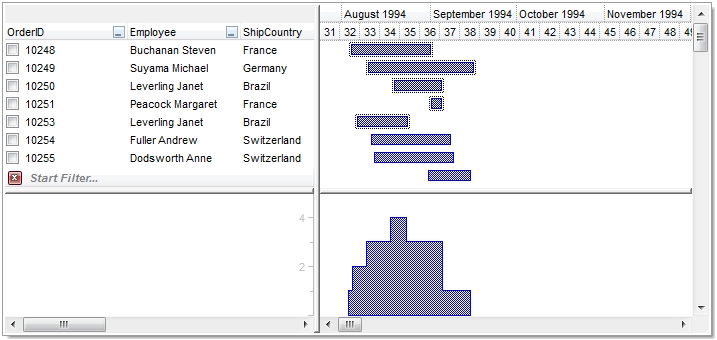
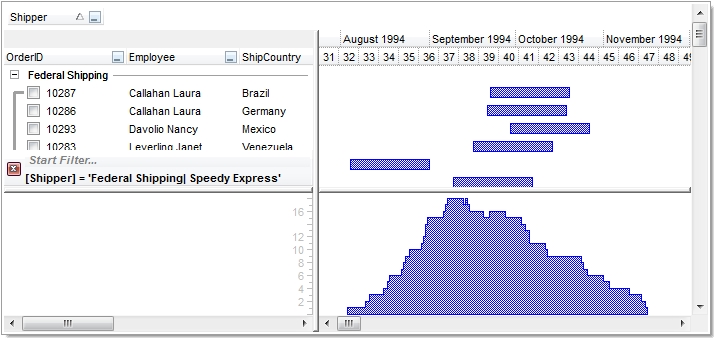
The following screen shot shows the histogram grouped by parent items (exHistogramNoGrouping
is not used):
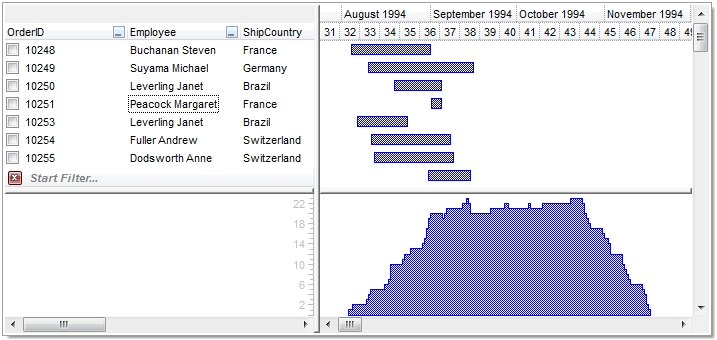
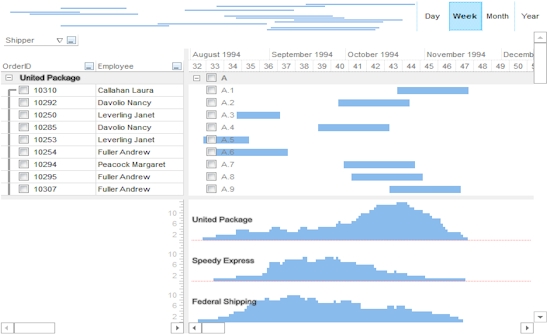
The following screen shot shows the histogram without grouping (exHistogramNoGrouping
is used):
| |
| |
exHistogramBackground | 2048
|
(exHistogramBackground/2048) The histogram's chart goes on the background, while the non-working part is shown on front ( erases the non-working parts ).
The following screen shot shows the histogram with the
exHistogramBackground flag set ( histogram on background ):
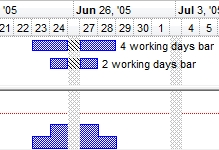
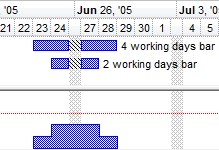
while the following shows the same histogram with no
exHistogramBackground flag ( histogram on front ):
| |
| |
exHistogramNoGroupCaption | 4096
|
(exHistogramNoGroupCaption/4096) The histogram shows no caption for groups being shown. The
exHistogramNoGroupCaption flag has no effect if the
exHistogramNoGrouping flag is set.
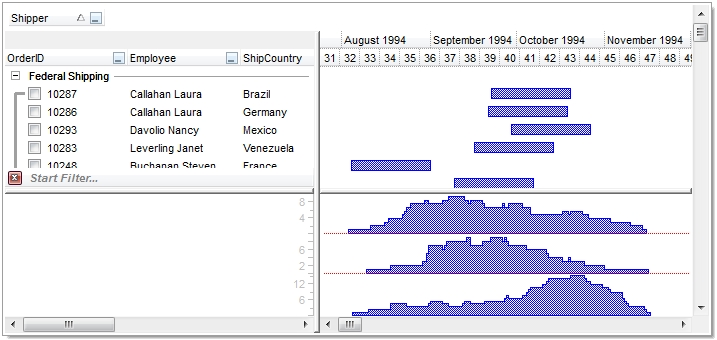
The following screen shot shows shows the group captions when
exHistogramNoGroupCaption flag is not set:
| |
| |
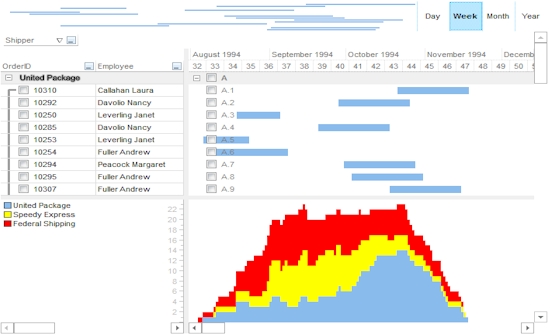
exHistogramGroupCumulative | 8192
|
(exHistogramGroupCumulative/8192) The histogram shows cumulative groups. The
exHistogramGroupCumulative flag has no effect if the
exHistogramNoGrouping flag is set. The HistogramCumulativeColors
property of the Bar indicates the number of colors that can be used in the
representation. The HistogramCumulativeColor
property of the Bar specifies the color to be used in the representation.
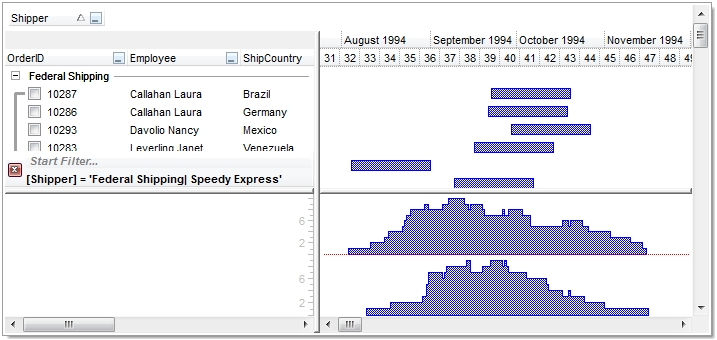
The following screen shot shows shows the histogram when the exHistogramGroupCumulative
flag is set:
| |

