|
2432
|
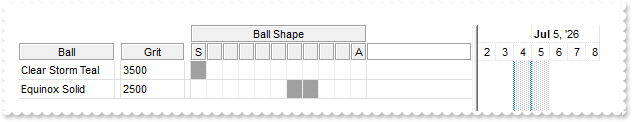
Arrange the header on multiple levels using CRD feature
/*
with (this.EXG2ANTTCHARTACTIVEXCONTROL1.nativeObject)
	AddColumn = class::nativeObject_AddColumn
endwith
*/
// Fired after a new column has been added.
function nativeObject_AddColumn(Column)
	oG2antt = form.EXG2ANTTCHARTACTIVEXCONTROL1.nativeObject
return

local h,oG2antt,sep,var_Column,var_Column1,var_Column10,var_Column11,var_Column12,var_Column13,var_Column14,var_Column15,var_Column2,var_Column3,var_Column4,var_Column5,var_Column6,var_Column7,var_Column8,var_Column9,var_Columns,var_Items

oG2antt = form.EXG2ANTTCHARTACTIVEXCONTROL1.nativeObject
sep = 6
oG2antt.BeginUpdate()
oG2antt.BackColorLevelHeader = 0xffffff
oG2antt.ColumnAutoResize = false
oG2antt.HeaderAppearance = 4
oG2antt.SelBackMode = 1
oG2antt.DrawGridLines = -2
oG2antt.GridLineStyle = 48
oG2antt.GridLineColor = 0xe0e0e0
var_Columns = oG2antt.Columns
	var_Column = var_Columns.Add("Ball")
		var_Column.Visible = true
		var_Column.Width = 96
		var_Column.Editor.EditType = 1
	// var_Columns.Add("Grit").Visible = true
	var_Column1 = var_Columns.Add("Grit")
	with (oG2antt)
		TemplateDef = [dim var_Column1]
		TemplateDef = var_Column1
		Template = [var_Column1.Visible = True]
	endwith
	var_Column2 = var_Columns.Add("Ball Shape")
		var_Column2.Visible = true
		var_Column2.FormatLevel = "2/3,4,5,6,7,8,9,10,11,12,13"
		// var_Column2.Def(32) = "3,4,5,6,7,8,9,10,11,12,13"
		with (oG2antt)
			TemplateDef = [dim var_Column2]
			TemplateDef = var_Column2
			Template = [var_Column2.Def(32) = "3,4,5,6,7,8,9,10,11,12,13"]
		endwith
		var_Column2.Width = 176
	// var_Columns.Add("S").Key = "Ball Shape.1"
	var_Column3 = var_Columns.Add("S")
	with (oG2antt)
		TemplateDef = [dim var_Column3]
		TemplateDef = var_Column3
		Template = [var_Column3.Key = "Ball Shape.1"]
	endwith
	// var_Columns.Add("").Key = "Ball Shape.2"
	var_Column4 = var_Columns.Add("")
	with (oG2antt)
		TemplateDef = [dim var_Column4]
		TemplateDef = var_Column4
		Template = [var_Column4.Key = "Ball Shape.2"]
	endwith
	// var_Columns.Add("").Key = "Ball Shape.3"
	var_Column5 = var_Columns.Add("")
	with (oG2antt)
		TemplateDef = [dim var_Column5]
		TemplateDef = var_Column5
		Template = [var_Column5.Key = "Ball Shape.3"]
	endwith
	// var_Columns.Add("").Key = "Ball Shape.4"
	var_Column6 = var_Columns.Add("")
	with (oG2antt)
		TemplateDef = [dim var_Column6]
		TemplateDef = var_Column6
		Template = [var_Column6.Key = "Ball Shape.4"]
	endwith
	// var_Columns.Add("").Key = "Ball Shape.5"
	var_Column7 = var_Columns.Add("")
	with (oG2antt)
		TemplateDef = [dim var_Column7]
		TemplateDef = var_Column7
		Template = [var_Column7.Key = "Ball Shape.5"]
	endwith
	// var_Columns.Add("").Key = "Ball Shape.6"
	var_Column8 = var_Columns.Add("")
	with (oG2antt)
		TemplateDef = [dim var_Column8]
		TemplateDef = var_Column8
		Template = [var_Column8.Key = "Ball Shape.6"]
	endwith
	// var_Columns.Add("").Key = "Ball Shape.7"
	var_Column9 = var_Columns.Add("")
	with (oG2antt)
		TemplateDef = [dim var_Column9]
		TemplateDef = var_Column9
		Template = [var_Column9.Key = "Ball Shape.7"]
	endwith
	// var_Columns.Add("").Key = "Ball Shape.8"
	var_Column10 = var_Columns.Add("")
	with (oG2antt)
		TemplateDef = [dim var_Column10]
		TemplateDef = var_Column10
		Template = [var_Column10.Key = "Ball Shape.8"]
	endwith
	// var_Columns.Add("").Key = "Ball Shape.9"
	var_Column11 = var_Columns.Add("")
	with (oG2antt)
		TemplateDef = [dim var_Column11]
		TemplateDef = var_Column11
		Template = [var_Column11.Key = "Ball Shape.9"]
	endwith
	// var_Columns.Add("").Key = "Ball Shape.10"
	var_Column12 = var_Columns.Add("")
	with (oG2antt)
		TemplateDef = [dim var_Column12]
		TemplateDef = var_Column12
		Template = [var_Column12.Key = "Ball Shape.10"]
	endwith
	// var_Columns.Add("A").Key = "Ball Shape.11"
	var_Column13 = var_Columns.Add("A")
	with (oG2antt)
		TemplateDef = [dim var_Column13]
		TemplateDef = var_Column13
		Template = [var_Column13.Key = "Ball Shape.11"]
	endwith
	var_Column14 = var_Columns.Add("")
		var_Column14.AllowSizing = false
		var_Column14.Visible = true
		// var_Column14.Def(7) = 33554431
		with (oG2antt)
			TemplateDef = [dim var_Column14]
			TemplateDef = var_Column14
			Template = [var_Column14.Def(7) = 33554431]
		endwith
		var_Column14.Width = sep
		var_Column14.Position = oG2antt.Columns.Item("Grit").Position
	var_Column15 = var_Columns.Add("")
		var_Column15.AllowSizing = false
		var_Column15.Visible = true
		// var_Column15.Def(7) = 33554431
		with (oG2antt)
			TemplateDef = [dim var_Column15]
			TemplateDef = var_Column15
			Template = [var_Column15.Def(7) = 33554431]
		endwith
		var_Column15.Width = sep
		var_Column15.Position = oG2antt.Columns.Item("Ball Shape").Position
var_Items = oG2antt.Items
	h = var_Items.AddItem("Clear Storm Teal")
	// var_Items.CellValue(h,"Grit") = 3500
	with (oG2antt)
		TemplateDef = [dim var_Items,h]
		TemplateDef = var_Items
		TemplateDef = h
		Template = [var_Items.CellValue(h,"Grit") = 3500]
	endwith
	// var_Items.CellBackColor(h,"Ball Shape.1") = 0xa0a0a0
	with (oG2antt)
		TemplateDef = [dim var_Items,h]
		TemplateDef = var_Items
		TemplateDef = h
		Template = [var_Items.CellBackColor(h,"Ball Shape.1") = 10526880]
	endwith
	h = var_Items.AddItem("Equinox Solid")
	// var_Items.CellValue(h,"Grit") = 2500
	with (oG2antt)
		TemplateDef = [dim var_Items,h]
		TemplateDef = var_Items
		TemplateDef = h
		Template = [var_Items.CellValue(h,"Grit") = 2500]
	endwith
	// var_Items.CellBackColor(h,"Ball Shape.7") = 0xa0a0a0
	with (oG2antt)
		TemplateDef = [dim var_Items,h]
		TemplateDef = var_Items
		TemplateDef = h
		Template = [var_Items.CellBackColor(h,"Ball Shape.7") = 10526880]
	endwith
	// var_Items.CellBackColor(h,"Ball Shape.8") = 0xa0a0a0
	with (oG2antt)
		TemplateDef = [dim var_Items,h]
		TemplateDef = var_Items
		TemplateDef = h
		Template = [var_Items.CellBackColor(h,"Ball Shape.8") = 10526880]
	endwith
oG2antt.EndUpdate()
|
|
2431
|
Temporarily disable events
/*
with (this.EXG2ANTTCHARTACTIVEXCONTROL1.nativeObject)
	AddItem = class::nativeObject_AddItem
endwith
*/
// Occurs after a new Item has been inserted to Items collection.
function nativeObject_AddItem(Item)
	oG2antt = form.EXG2ANTTCHARTACTIVEXCONTROL1.nativeObject
	? "AddItem event"
return

local oG2antt,var_Items

oG2antt = form.EXG2ANTTCHARTACTIVEXCONTROL1.nativeObject
oG2antt.FreezeEvents(true)
oG2antt.BeginUpdate()
oG2antt.Columns.Add("Name")
var_Items = oG2antt.Items
	var_Items.AddItem("no AddItem event occurs")
oG2antt.EndUpdate()
oG2antt.FreezeEvents(false)
|
|
2430
|
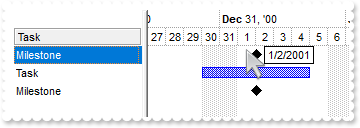
Show the DateTickerLabel for Milestones
local oG2antt,var_Chart,var_Items

oG2antt = form.EXG2ANTTCHARTACTIVEXCONTROL1.nativeObject
oG2antt.BeginUpdate()
oG2antt.Columns.Add("Task")
oG2antt.HeaderAppearance = 4
oG2antt.Template = [Background(195) = 1] // oG2antt.Background(195) = 0x1
oG2antt.Template = [Background(196) = 4] // oG2antt.Background(196) = 0x4
var_Chart = oG2antt.Chart
	var_Chart.LevelCount = 2
	// var_Chart.PaneWidth(false) = 128
	with (oG2antt)
		TemplateDef = [dim var_Chart]
		TemplateDef = var_Chart
		Template = [var_Chart.PaneWidth(False) = 128]
	endwith
	var_Chart.FirstVisibleDate = "12/22/2000"
	var_Chart.DateTickerLabel = "<%=value%>"
var_Items = oG2antt.Items
	var_Items.AddBar(var_Items.AddItem("Milestone"),"Milestone","01/02/2001","01/02/2001")
	var_Items.AddBar(var_Items.AddItem("Task"),"Task","12/30/2000","01/05/2001")
	var_Items.AddBar(var_Items.AddItem("Milestone"),"Milestone","01/02/2001","01/02/2001")
oG2antt.EndUpdate()
|
|
2429
|
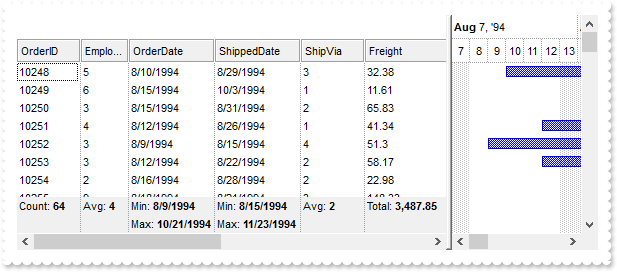
Add a footer that displays totals or summary values
/*
with (this.EXG2ANTTCHARTACTIVEXCONTROL1.nativeObject)
	AddItem = class::nativeObject_AddItem
endwith
*/
// Occurs after a new Item has been inserted to Items collection.
function nativeObject_AddItem(Item)
	local var_Items
	oG2antt = form.EXG2ANTTCHARTACTIVEXCONTROL1.nativeObject
	var_Items = oG2antt.Items
		var_Items.AddBar(Item,"Task",var_Items.CellValue(Item,2),var_Items.CellValue(Item,4))
return

/*
with (this.EXG2ANTTCHARTACTIVEXCONTROL1.nativeObject)
	Change = class::nativeObject_Change
endwith
*/
// Occurs when the user changes the cell's content.
function nativeObject_Change(Item, ColIndex, NewValue)
	oG2antt = form.EXG2ANTTCHARTACTIVEXCONTROL1.nativeObject
	oG2antt.Refresh()
return

local h,oG2antt,rs,var_Chart,var_Columns,var_Columns1,var_Items

oG2antt = form.EXG2ANTTCHARTACTIVEXCONTROL1.nativeObject
oG2antt.HeaderAppearance = 4
oG2antt.HeaderHeight = 24
oG2antt.ColumnAutoResize = false
oG2antt.ContinueColumnScroll = false
oG2antt.DrawGridLines = 2
oG2antt.GridLineStyle = 512
var_Chart = oG2antt.Chart
	var_Chart.FirstVisibleDate = "08/04/1994"
	var_Chart.LevelCount = 2
	// var_Chart.PaneWidth(false) = 256
	with (oG2antt)
		TemplateDef = [dim var_Chart]
		TemplateDef = var_Chart
		Template = [var_Chart.PaneWidth(False) = 256]
	endwith
rs = new OleAutoClient("ADOR.Recordset")
	rs.Open("Orders","Provider=Microsoft.ACE.OLEDB.12.0;Data Source=C:\Program Files\Exontrol\ExG2antt\Sample\Access\misc.accdb",3,3)
oG2antt.DataSource = rs
oG2antt.Items.AllowCellValueToItemBar = true
// oG2antt.Columns.Item(2).Def(18) = 1
var_Columns = oG2antt.Columns.Item(2)
with (oG2antt)
	TemplateDef = [dim var_Columns]
	TemplateDef = var_Columns
	Template = [var_Columns.Def(18) = 1]
endwith
// oG2antt.Columns.Item(4).Def(18) = 2
var_Columns1 = oG2antt.Columns.Item(4)
with (oG2antt)
	TemplateDef = [dim var_Columns1]
	TemplateDef = var_Columns1
	Template = [var_Columns1.Def(18) = 2]
endwith
oG2antt.Columns.Item("EmployeeID").Width = 48
oG2antt.Columns.Item("OrderDate").Width = 86
oG2antt.Columns.Item("RequiredDate").Width = 86
oG2antt.Columns.Item("ShippedDate").Width = 86
oG2antt.Columns.Item("Freight").Width = 86
var_Items = oG2antt.Items
	// var_Items.LockedItemCount(2) = 2
	with (oG2antt)
		TemplateDef = [dim var_Items]
		TemplateDef = var_Items
		Template = [var_Items.LockedItemCount(2) = 2]
	endwith
	h = var_Items.LockedItem(2,0)
	// var_Items.ItemBackColor(h) = 0xf0f0f0
	with (oG2antt)
		TemplateDef = [dim var_Items,h]
		TemplateDef = var_Items
		TemplateDef = h
		Template = [var_Items.ItemBackColor(h) = 15790320]
	endwith
	// var_Items.CellValueFormat(h,0) = 5 /*exTotalField | exHTML*/
	with (oG2antt)
		TemplateDef = [dim var_Items,h]
		TemplateDef = var_Items
		TemplateDef = h
		Template = [var_Items.CellValueFormat(h,0) = 5]
	endwith
	// var_Items.CellValue(h,0) = "count(all,dir,%0)"
	with (oG2antt)
		TemplateDef = [dim var_Items,h]
		TemplateDef = var_Items
		TemplateDef = h
		Template = [var_Items.CellValue(h,0) = "count(all,dir,%0)"]
	endwith
	// var_Items.FormatCell(h,0) = "`Count: <b>` + value"
	with (oG2antt)
		TemplateDef = [dim var_Items,h]
		TemplateDef = var_Items
		TemplateDef = h
		Template = [var_Items.FormatCell(h,0) = "`Count: <b>` + value"]
	endwith
	// var_Items.CellValueFormat(h,1) = 5 /*exTotalField | exHTML*/
	with (oG2antt)
		TemplateDef = [dim var_Items,h]
		TemplateDef = var_Items
		TemplateDef = h
		Template = [var_Items.CellValueFormat(h,1) = 5]
	endwith
	// var_Items.CellValue(h,1) = "avg(all,dir,%1)"
	with (oG2antt)
		TemplateDef = [dim var_Items,h]
		TemplateDef = var_Items
		TemplateDef = h
		Template = [var_Items.CellValue(h,1) = "avg(all,dir,%1)"]
	endwith
	// var_Items.FormatCell(h,1) = "`Avg: <b>` + int(value)"
	with (oG2antt)
		TemplateDef = [dim var_Items,h]
		TemplateDef = var_Items
		TemplateDef = h
		Template = [var_Items.FormatCell(h,1) = "`Avg: <b>` + int(value)"]
	endwith
	// var_Items.CellValueFormat(h,2) = 5 /*exTotalField | exHTML*/
	with (oG2antt)
		TemplateDef = [dim var_Items,h]
		TemplateDef = var_Items
		TemplateDef = h
		Template = [var_Items.CellValueFormat(h,2) = 5]
	endwith
	// var_Items.CellValue(h,2) = "min(all,dir,%2)"
	with (oG2antt)
		TemplateDef = [dim var_Items,h]
		TemplateDef = var_Items
		TemplateDef = h
		Template = [var_Items.CellValue(h,2) = "min(all,dir,%2)"]
	endwith
	// var_Items.FormatCell(h,2) = "`Min: <b>` + value"
	with (oG2antt)
		TemplateDef = [dim var_Items,h]
		TemplateDef = var_Items
		TemplateDef = h
		Template = [var_Items.FormatCell(h,2) = "`Min: <b>` + value"]
	endwith
	// var_Items.CellValueFormat(h,3) = 5 /*exTotalField | exHTML*/
	with (oG2antt)
		TemplateDef = [dim var_Items,h]
		TemplateDef = var_Items
		TemplateDef = h
		Template = [var_Items.CellValueFormat(h,3) = 5]
	endwith
	// var_Items.CellValue(h,3) = "min(all,dir,%3)"
	with (oG2antt)
		TemplateDef = [dim var_Items,h]
		TemplateDef = var_Items
		TemplateDef = h
		Template = [var_Items.CellValue(h,3) = "min(all,dir,%3)"]
	endwith
	// var_Items.FormatCell(h,3) = "`Min: <b>` + value"
	with (oG2antt)
		TemplateDef = [dim var_Items,h]
		TemplateDef = var_Items
		TemplateDef = h
		Template = [var_Items.FormatCell(h,3) = "`Min: <b>` + value"]
	endwith
	// var_Items.CellValueFormat(h,4) = 5 /*exTotalField | exHTML*/
	with (oG2antt)
		TemplateDef = [dim var_Items,h]
		TemplateDef = var_Items
		TemplateDef = h
		Template = [var_Items.CellValueFormat(h,4) = 5]
	endwith
	// var_Items.CellValue(h,4) = "min(all,dir,%4)"
	with (oG2antt)
		TemplateDef = [dim var_Items,h]
		TemplateDef = var_Items
		TemplateDef = h
		Template = [var_Items.CellValue(h,4) = "min(all,dir,%4)"]
	endwith
	// var_Items.FormatCell(h,4) = "`Min: <b>` + value"
	with (oG2antt)
		TemplateDef = [dim var_Items,h]
		TemplateDef = var_Items
		TemplateDef = h
		Template = [var_Items.FormatCell(h,4) = "`Min: <b>` + value"]
	endwith
	// var_Items.CellValueFormat(h,5) = 5 /*exTotalField | exHTML*/
	with (oG2antt)
		TemplateDef = [dim var_Items,h]
		TemplateDef = var_Items
		TemplateDef = h
		Template = [var_Items.CellValueFormat(h,5) = 5]
	endwith
	// var_Items.CellValue(h,5) = "avg(all,dir,%5)"
	with (oG2antt)
		TemplateDef = [dim var_Items,h]
		TemplateDef = var_Items
		TemplateDef = h
		Template = [var_Items.CellValue(h,5) = "avg(all,dir,%5)"]
	endwith
	// var_Items.FormatCell(h,5) = "`Avg: <b>` + int(value)"
	with (oG2antt)
		TemplateDef = [dim var_Items,h]
		TemplateDef = var_Items
		TemplateDef = h
		Template = [var_Items.FormatCell(h,5) = "`Avg: <b>` + int(value)"]
	endwith
	// var_Items.CellValueFormat(h,6) = 5 /*exTotalField | exHTML*/
	with (oG2antt)
		TemplateDef = [dim var_Items,h]
		TemplateDef = var_Items
		TemplateDef = h
		Template = [var_Items.CellValueFormat(h,6) = 5]
	endwith
	// var_Items.CellValue(h,6) = "sum(all,dir,%6)"
	with (oG2antt)
		TemplateDef = [dim var_Items,h]
		TemplateDef = var_Items
		TemplateDef = h
		Template = [var_Items.CellValue(h,6) = "sum(all,dir,%6)"]
	endwith
	// var_Items.FormatCell(h,6) = "`Total: <b>` + (value format `2`)"
	with (oG2antt)
		TemplateDef = [dim var_Items,h]
		TemplateDef = var_Items
		TemplateDef = h
		Template = [var_Items.FormatCell(h,6) = "`Total: <b>` + (value format `2`)"]
	endwith
	h = var_Items.LockedItem(2,1)
	// var_Items.ItemBackColor(h) = 0xf0f0f0
	with (oG2antt)
		TemplateDef = [dim var_Items,h]
		TemplateDef = var_Items
		TemplateDef = h
		Template = [var_Items.ItemBackColor(h) = 15790320]
	endwith
	// var_Items.CellValueFormat(h,2) = 5 /*exTotalField | exHTML*/
	with (oG2antt)
		TemplateDef = [dim var_Items,h]
		TemplateDef = var_Items
		TemplateDef = h
		Template = [var_Items.CellValueFormat(h,2) = 5]
	endwith
	// var_Items.CellValue(h,2) = "max(all,dir,%2)"
	with (oG2antt)
		TemplateDef = [dim var_Items,h]
		TemplateDef = var_Items
		TemplateDef = h
		Template = [var_Items.CellValue(h,2) = "max(all,dir,%2)"]
	endwith
	// var_Items.FormatCell(h,2) = "`Max: <b>` + value"
	with (oG2antt)
		TemplateDef = [dim var_Items,h]
		TemplateDef = var_Items
		TemplateDef = h
		Template = [var_Items.FormatCell(h,2) = "`Max: <b>` + value"]
	endwith
	// var_Items.CellValueFormat(h,3) = 5 /*exTotalField | exHTML*/
	with (oG2antt)
		TemplateDef = [dim var_Items,h]
		TemplateDef = var_Items
		TemplateDef = h
		Template = [var_Items.CellValueFormat(h,3) = 5]
	endwith
	// var_Items.CellValue(h,3) = "max(all,dir,%3)"
	with (oG2antt)
		TemplateDef = [dim var_Items,h]
		TemplateDef = var_Items
		TemplateDef = h
		Template = [var_Items.CellValue(h,3) = "max(all,dir,%3)"]
	endwith
	// var_Items.FormatCell(h,3) = "`Max: <b>` + value"
	with (oG2antt)
		TemplateDef = [dim var_Items,h]
		TemplateDef = var_Items
		TemplateDef = h
		Template = [var_Items.FormatCell(h,3) = "`Max: <b>` + value"]
	endwith
	// var_Items.CellValueFormat(h,4) = 5 /*exTotalField | exHTML*/
	with (oG2antt)
		TemplateDef = [dim var_Items,h]
		TemplateDef = var_Items
		TemplateDef = h
		Template = [var_Items.CellValueFormat(h,4) = 5]
	endwith
	// var_Items.CellValue(h,4) = "max(all,dir,%4)"
	with (oG2antt)
		TemplateDef = [dim var_Items,h]
		TemplateDef = var_Items
		TemplateDef = h
		Template = [var_Items.CellValue(h,4) = "max(all,dir,%4)"]
	endwith
	// var_Items.FormatCell(h,4) = "`Max: <b>` + value"
	with (oG2antt)
		TemplateDef = [dim var_Items,h]
		TemplateDef = var_Items
		TemplateDef = h
		Template = [var_Items.FormatCell(h,4) = "`Max: <b>` + value"]
	endwith
|
|
2428
|
GroupBars: (interval) Preserves both bars' lengths, ignores original interval, bars must be between 1 and 7 days apart
local h1,h2,oG2antt,var_Chart,var_Items

oG2antt = form.EXG2ANTTCHARTACTIVEXCONTROL1.nativeObject
oG2antt.BeginUpdate()
oG2antt.Columns.Add("Task")
oG2antt.HeaderAppearance = 4
oG2antt.HeaderVisible = 1
var_Chart = oG2antt.Chart
	var_Chart.LevelCount = 2
	var_Chart.FirstVisibleDate = "01/01/2001"
	// var_Chart.PaneWidth(false) = 128
	with (oG2antt)
		TemplateDef = [dim var_Chart]
		TemplateDef = var_Chart
		Template = [var_Chart.PaneWidth(False) = 128]
	endwith
var_Items = oG2antt.Items
	h1 = var_Items.AddItem("Task 1")
	var_Items.AddBar(h1,"Task","01/02/2001","01/04/2001","K1")
	h2 = var_Items.AddItem("Task 2")
	var_Items.AddBar(h2,"Task","01/05/2001","01/07/2001","K2")
	var_Items.GroupBars(h1,"K1",false,h2,"K2",true,31,"0;1;7")
oG2antt.EndUpdate()
|
|
2427
|
GroupBars: (maximum interval) Preserves both bars' lengths, ignores original interval, bars can be at most 2 days apart
local h1,h2,oG2antt,var_Chart,var_Items

oG2antt = form.EXG2ANTTCHARTACTIVEXCONTROL1.nativeObject
oG2antt.BeginUpdate()
oG2antt.Columns.Add("Task")
oG2antt.HeaderAppearance = 4
oG2antt.HeaderVisible = 1
var_Chart = oG2antt.Chart
	var_Chart.LevelCount = 2
	var_Chart.FirstVisibleDate = "01/01/2001"
	// var_Chart.PaneWidth(false) = 128
	with (oG2antt)
		TemplateDef = [dim var_Chart]
		TemplateDef = var_Chart
		Template = [var_Chart.PaneWidth(False) = 128]
	endwith
var_Items = oG2antt.Items
	h1 = var_Items.AddItem("Task 1")
	var_Items.AddBar(h1,"Task","01/02/2001","01/04/2001","K1")
	h2 = var_Items.AddItem("Task 2")
	var_Items.AddBar(h2,"Task","01/05/2001","01/07/2001","K2")
	var_Items.GroupBars(h1,"K1",false,h2,"K2",true,31,"0;0;2")
oG2antt.EndUpdate()
|
|
2426
|
GroupBars: (minimum interval) Preserves both bars' lengths, ignores original interval, bars must be at least 2 days apart
local h1,h2,oG2antt,var_Chart,var_Items

oG2antt = form.EXG2ANTTCHARTACTIVEXCONTROL1.nativeObject
oG2antt.BeginUpdate()
oG2antt.Columns.Add("Task")
oG2antt.HeaderAppearance = 4
oG2antt.HeaderVisible = 1
var_Chart = oG2antt.Chart
	var_Chart.LevelCount = 2
	var_Chart.FirstVisibleDate = "01/01/2001"
	// var_Chart.PaneWidth(false) = 128
	with (oG2antt)
		TemplateDef = [dim var_Chart]
		TemplateDef = var_Chart
		Template = [var_Chart.PaneWidth(False) = 128]
	endwith
var_Items = oG2antt.Items
	h1 = var_Items.AddItem("Task 1")
	var_Items.AddBar(h1,"Task","01/02/2001","01/04/2001","K1")
	h2 = var_Items.AddItem("Task 2")
	var_Items.AddBar(h2,"Task","01/05/2001","01/07/2001","K2")
	var_Items.GroupBars(h1,"K1",false,h2,"K2",true,15,"2")
oG2antt.EndUpdate()
|
|
2425
|
GroupBars: (fixed) Preserves both bars' lengths, ignores original interval, sets exact distance of 2 days between bars
local h1,h2,oG2antt,var_Chart,var_Items

oG2antt = form.EXG2ANTTCHARTACTIVEXCONTROL1.nativeObject
oG2antt.BeginUpdate()
oG2antt.Columns.Add("Task")
oG2antt.HeaderAppearance = 4
oG2antt.HeaderVisible = 1
var_Chart = oG2antt.Chart
	var_Chart.LevelCount = 2
	var_Chart.FirstVisibleDate = "01/01/2001"
	// var_Chart.PaneWidth(false) = 128
	with (oG2antt)
		TemplateDef = [dim var_Chart]
		TemplateDef = var_Chart
		Template = [var_Chart.PaneWidth(False) = 128]
	endwith
var_Items = oG2antt.Items
	h1 = var_Items.AddItem("Task 1")
	var_Items.AddBar(h1,"Task","01/02/2001","01/04/2001","K1")
	h2 = var_Items.AddItem("Task 2")
	var_Items.AddBar(h2,"Task","01/05/2001","01/07/2001","K2")
	var_Items.GroupBars(h1,"K1",false,h2,"K2",true,7,"2")
oG2antt.EndUpdate()
|
|
2424
|
GroupBars: (block) Links the starts and ends of the bars so they move and resize together as a block
local h1,h2,oG2antt,var_Chart,var_Items

oG2antt = form.EXG2ANTTCHARTACTIVEXCONTROL1.nativeObject
oG2antt.BeginUpdate()
oG2antt.Columns.Add("Task")
oG2antt.HeaderAppearance = 4
oG2antt.HeaderVisible = 1
var_Chart = oG2antt.Chart
	var_Chart.LevelCount = 2
	var_Chart.FirstVisibleDate = "01/01/2001"
	// var_Chart.PaneWidth(false) = 128
	with (oG2antt)
		TemplateDef = [dim var_Chart]
		TemplateDef = var_Chart
		Template = [var_Chart.PaneWidth(False) = 128]
	endwith
var_Items = oG2antt.Items
	h1 = var_Items.AddItem("Task 1")
	var_Items.AddBar(h1,"Task","01/02/2001","01/04/2001","K1")
	h2 = var_Items.AddItem("Task 2")
	var_Items.AddBar(h2,"Task","01/05/2001","01/07/2001","K2")
	var_Items.GroupBars(h1,"K1",true,h2,"K2",true)
	var_Items.GroupBars(h1,"K1",false,h2,"K2",false)
oG2antt.EndUpdate()
|
|
2423
|
How can I prevent the control from filtering while the user is typing in the filter prompt, and apply the filter only when the Enter key is pressed
local oG2antt,var_Items
oG2antt = form.EXG2ANTTCHARTACTIVEXCONTROL1.nativeObject
oG2antt.BeginUpdate()
oG2antt.ColumnAutoResize = true
oG2antt.ContinueColumnScroll = false
oG2antt.MarkSearchColumn = false
oG2antt.SearchColumnIndex = 1
oG2antt.HeaderAppearance = 4
oG2antt.HeaderHeight = 24
oG2antt.FilterBarPromptVisible = 16385 /*exFilterBarPromptOnEnter | exFilterBarPromptVisible*/
oG2antt.FilterBarPrompt = "<i><fgcolor=808080>Type filter and press Enter�</fgcolor></i>"
oG2antt.FilterBarBackColor = oG2antt.BackColor
oG2antt.FilterBarPromptType = 3
oG2antt.Columns.Add("Name")
var_Items = oG2antt.Items
var_Items.AddItem("Nancy Davolio")
var_Items.AddItem("Andrew Fuller")
var_Items.AddItem("Janet Leverling")
var_Items.AddItem("Margaret Peacock")
var_Items.AddItem("Steven Buchanan")
var_Items.AddItem("Michael Suyama")
var_Items.AddItem("Robert King")
var_Items.AddItem("Laura Callahan")
var_Items.AddItem("Anne Dodsworth")
oG2antt.EndUpdate()
|
|
2422
|
It is possible to round exBarPercent to a multiple of the bar percent step when setting it with the mouse (exBarResizePercentStep, method 2)
local h,oG2antt,var_Bar,var_Chart,var_Items

oG2antt = form.EXG2ANTTCHARTACTIVEXCONTROL1.nativeObject
oG2antt.BeginUpdate()
oG2antt.Columns.Add("Task")
var_Chart = oG2antt.Chart
	var_Chart.LevelCount = 2
	var_Chart.FirstVisibleDate = "01/01/2001"
	// var_Chart.PaneWidth(false) = 64
	with (oG2antt)
		TemplateDef = [dim var_Chart]
		TemplateDef = var_Chart
		Template = [var_Chart.PaneWidth(False) = 64]
	endwith
	var_Bar = var_Chart.Bars.Add("Task%Progress")
		var_Bar.Shortcut = "Task-Percent"
		// var_Bar.Def(14) = true
		with (oG2antt)
			TemplateDef = [dim var_Bar]
			TemplateDef = var_Bar
			Template = [var_Bar.Def(14) = True]
		endwith
		// var_Bar.Def(61) = 0.05
		with (oG2antt)
			TemplateDef = [dim var_Bar]
			TemplateDef = var_Bar
			Template = [var_Bar.Def(61) = 0.05]
		endwith
var_Items = oG2antt.Items
	h = var_Items.AddItem("Task 1")
	var_Items.AddBar(h,"Task-Percent","01/02/2001","01/26/2001","K1")
	// var_Items.ItemBar(h,"K1",12) = 0.4
	with (oG2antt)
		TemplateDef = [dim var_Items,h]
		TemplateDef = var_Items
		TemplateDef = h
		Template = [var_Items.ItemBar(h,"K1",12) = 0.4]
	endwith
	h = var_Items.AddItem("Task 2")
	var_Items.AddBar(h,"Task-Percent","01/02/2001","01/16/2001","K1")
	// var_Items.ItemBar(h,"K1",12) = 0.15
	with (oG2antt)
		TemplateDef = [dim var_Items,h]
		TemplateDef = var_Items
		TemplateDef = h
		Template = [var_Items.ItemBar(h,"K1",12) = 0.15]
	endwith
oG2antt.EndUpdate()
|
|
2421
|
It is possible to round the exBarPercent to 5% or 10% when setting it with the mouse (exBarResizePercentStep, method 1)
local h,oG2antt,var_Bar,var_Chart,var_Items

oG2antt = form.EXG2ANTTCHARTACTIVEXCONTROL1.nativeObject
oG2antt.BeginUpdate()
oG2antt.Columns.Add("Task")
var_Chart = oG2antt.Chart
	var_Chart.LevelCount = 2
	var_Chart.FirstVisibleDate = "01/01/2001"
	// var_Chart.PaneWidth(false) = 64
	with (oG2antt)
		TemplateDef = [dim var_Chart]
		TemplateDef = var_Chart
		Template = [var_Chart.PaneWidth(False) = 64]
	endwith
	var_Bar = var_Chart.Bars.Add("Task%Progress")
		var_Bar.Shortcut = "Task-Percent"
		// var_Bar.Def(14) = true
		with (oG2antt)
			TemplateDef = [dim var_Bar]
			TemplateDef = var_Bar
			Template = [var_Bar.Def(14) = True]
		endwith
var_Items = oG2antt.Items
	h = var_Items.AddItem("Task")
	var_Items.AddBar(h,"Task-Percent","01/02/2001","01/26/2001","K1")
	// var_Items.ItemBar(h,"K1",12) = 0.4
	with (oG2antt)
		TemplateDef = [dim var_Items,h]
		TemplateDef = var_Items
		TemplateDef = h
		Template = [var_Items.ItemBar(h,"K1",12) = 0.4]
	endwith
	// var_Items.ItemBar(h,"K1",61) = 0.05
	with (oG2antt)
		TemplateDef = [dim var_Items,h]
		TemplateDef = var_Items
		TemplateDef = h
		Template = [var_Items.ItemBar(h,"K1",61) = 0.05]
	endwith
oG2antt.EndUpdate()
|
|
2420
|
Drag a bar vertically to another item without changing its time (horizontally)
/*
with (this.EXG2ANTTCHARTACTIVEXCONTROL1.nativeObject)
	BarParentChange = class::nativeObject_BarParentChange
endwith
*/
// Occurs just before moving a bar from current item to another item.
function nativeObject_BarParentChange(Item, Key, NewItem, Cancel)
	local var_Items
	oG2antt = form.EXG2ANTTCHARTACTIVEXCONTROL1.nativeObject
	var_Items = oG2antt.Items
		? Str(var_Items.CellValue(NewItem,0))
return

local h,oG2antt,var_Chart,var_Items

oG2antt = form.EXG2ANTTCHARTACTIVEXCONTROL1.nativeObject
oG2antt.BeginUpdate()
var_Chart = oG2antt.Chart
	var_Chart.LevelCount = 2
	// var_Chart.PaneWidth(false) = 128
	with (oG2antt)
		TemplateDef = [dim var_Chart]
		TemplateDef = var_Chart
		Template = [var_Chart.PaneWidth(False) = 128]
	endwith
	var_Chart.FirstVisibleDate = "01/01/2001"
	var_Chart.AllowLinkBars = false
oG2antt.Columns.Add("Column")
var_Items = oG2antt.Items
	var_Items.AddItem("Item 1")
	h = var_Items.AddItem("Item 2")
	var_Items.AddBar(h,"Task","01/05/2001","01/07/2001","B","bar moves vertically only")
	// var_Items.ItemBar(h,"B",28) = true
	with (oG2antt)
		TemplateDef = [dim var_Items,h]
		TemplateDef = var_Items
		TemplateDef = h
		Template = [var_Items.ItemBar(h,"B",28) = True]
	endwith
	// var_Items.ItemBar(h,"B",11) = false
	with (oG2antt)
		TemplateDef = [dim var_Items,h]
		TemplateDef = var_Items
		TemplateDef = h
		Template = [var_Items.ItemBar(h,"B",11) = False]
	endwith
	var_Items.AddItem("Item 3")
oG2antt.EndUpdate()
|
|
2419
|
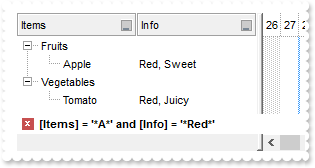
Using exFilterPatternTemplate flag with multiple columns
local h,oG2antt,var_Column,var_Column1,var_Items

oG2antt = form.EXG2ANTTCHARTACTIVEXCONTROL1.nativeObject
oG2antt.BeginUpdate()
oG2antt.HeaderAppearance = 4
oG2antt.HeaderHeight = 24
oG2antt.LinesAtRoot = -1
var_Column = oG2antt.Columns.Add("Items")
	var_Column.DisplayFilterButton = true
	var_Column.DisplayFilterPattern = true
	// var_Column.Def(21) = "*<%filter%>*"
	with (oG2antt)
		TemplateDef = [dim var_Column]
		TemplateDef = var_Column
		Template = [var_Column.Def(21) = "*<%filter%>*"]
	endwith
	var_Column.FilterType = 3
	var_Column.Filter = "A"
var_Column1 = oG2antt.Columns.Add("Info")
	var_Column1.DisplayFilterButton = true
	var_Column1.DisplayFilterPattern = true
	// var_Column1.Def(21) = "*<%filter%>*"
	with (oG2antt)
		TemplateDef = [dim var_Column1]
		TemplateDef = var_Column1
		Template = [var_Column1.Def(21) = "*<%filter%>*"]
	endwith
	var_Column1.FilterType = 3
	var_Column1.Filter = "Red"
var_Items = oG2antt.Items
	h = var_Items.AddItem("Fruits")
	// var_Items.CellValue(var_Items.InsertItem(h,null,"Apple"),1) = "Red, Sweet"
	with (oG2antt)
		TemplateDef = [dim var_Items]
		TemplateDef = var_Items
		Template = [var_Items.CellValue(InsertItem(h,,"Apple"),1) = "Red, Sweet"]
	endwith
	// var_Items.CellValue(var_Items.InsertItem(h,null,"Banana"),1) = "Yellow, Soft"
	with (oG2antt)
		TemplateDef = [dim var_Items]
		TemplateDef = var_Items
		Template = [var_Items.CellValue(InsertItem(h,,"Banana"),1) = "Yellow, Soft"]
	endwith
	// var_Items.CellValue(var_Items.InsertItem(h,null,"Cherry"),1) = "Red, Small"
	with (oG2antt)
		TemplateDef = [dim var_Items]
		TemplateDef = var_Items
		Template = [var_Items.CellValue(InsertItem(h,,"Cherry"),1) = "Red, Small"]
	endwith
	// var_Items.ExpandItem(h) = true
	with (oG2antt)
		TemplateDef = [dim var_Items,h]
		TemplateDef = var_Items
		TemplateDef = h
		Template = [var_Items.ExpandItem(h) = True]
	endwith
	h = var_Items.AddItem("Vegetables")
	// var_Items.CellValue(var_Items.InsertItem(h,null,"Tomato"),1) = "Red, Juicy"
	with (oG2antt)
		TemplateDef = [dim var_Items]
		TemplateDef = var_Items
		Template = [var_Items.CellValue(InsertItem(h,,"Tomato"),1) = "Red, Juicy"]
	endwith
	// var_Items.CellValue(var_Items.InsertItem(h,null,"Carrot"),1) = "Orange, Crunchy"
	with (oG2antt)
		TemplateDef = [dim var_Items]
		TemplateDef = var_Items
		Template = [var_Items.CellValue(InsertItem(h,,"Carrot"),1) = "Orange, Crunchy"]
	endwith
	// var_Items.CellValue(var_Items.InsertItem(h,null,"Broccoli"),1) = "Green, Healthy"
	with (oG2antt)
		TemplateDef = [dim var_Items]
		TemplateDef = var_Items
		Template = [var_Items.CellValue(InsertItem(h,,"Broccoli"),1) = "Green, Healthy"]
	endwith
	// var_Items.ExpandItem(h) = true
	with (oG2antt)
		TemplateDef = [dim var_Items,h]
		TemplateDef = var_Items
		TemplateDef = h
		Template = [var_Items.ExpandItem(h) = True]
	endwith
	h = var_Items.AddItem("Animals")
	// var_Items.CellValue(var_Items.InsertItem(h,null,"Cat"),1) = "Small, Furry"
	with (oG2antt)
		TemplateDef = [dim var_Items]
		TemplateDef = var_Items
		Template = [var_Items.CellValue(InsertItem(h,,"Cat"),1) = "Small, Furry"]
	endwith
	// var_Items.CellValue(var_Items.InsertItem(h,null,"Dog"),1) = "Loyal, Friendly"
	with (oG2antt)
		TemplateDef = [dim var_Items]
		TemplateDef = var_Items
		Template = [var_Items.CellValue(InsertItem(h,,"Dog"),1) = "Loyal, Friendly"]
	endwith
	// var_Items.CellValue(var_Items.InsertItem(h,null,"Elephant"),1) = "Big, Gray"
	with (oG2antt)
		TemplateDef = [dim var_Items]
		TemplateDef = var_Items
		Template = [var_Items.CellValue(InsertItem(h,,"Elephant"),1) = "Big, Gray"]
	endwith
	// var_Items.ExpandItem(h) = true
	with (oG2antt)
		TemplateDef = [dim var_Items,h]
		TemplateDef = var_Items
		TemplateDef = h
		Template = [var_Items.ExpandItem(h) = True]
	endwith
oG2antt.ApplyFilter()
oG2antt.EndUpdate()
|
|
2418
|
How can I set the first visible item (method 2)
local oG2antt,rs,var_Column,var_Items

oG2antt = form.EXG2ANTTCHARTACTIVEXCONTROL1.nativeObject
oG2antt.BeginUpdate()
oG2antt.HasLines = 0
oG2antt.ColumnAutoResize = false
rs = new OleAutoClient("ADOR.Recordset")
	rs.Open("Orders","Provider=Microsoft.ACE.OLEDB.12.0;Data Source=C:\Program Files\Exontrol\ExG2antt\Sample\Access\misc.accdb",3,3)
oG2antt.DataSource = rs
var_Column = oG2antt.Columns.Add("Pos")
	var_Column.FormatColumn = "0 pos ``"
	var_Column.Position = 0
	var_Column.Width = 32
oG2antt.CountLockedColumns = 1
oG2antt.Scroll(2,oG2antt.Items.ItemCount)
oG2antt.EndUpdate()
var_Items = oG2antt.Items
	var_Items.EnsureVisibleItem(var_Items.ItemByIndex(10))
|
|
2417
|
How can I set the first visible item (method 1)
local oG2antt,rs,var_Column

oG2antt = form.EXG2ANTTCHARTACTIVEXCONTROL1.nativeObject
oG2antt.BeginUpdate()
oG2antt.HasLines = 0
oG2antt.ColumnAutoResize = false
rs = new OleAutoClient("ADOR.Recordset")
	rs.Open("Orders","Provider=Microsoft.ACE.OLEDB.12.0;Data Source=C:\Program Files\Exontrol\ExG2antt\Sample\Access\misc.accdb",3,3)
oG2antt.DataSource = rs
var_Column = oG2antt.Columns.Add("Pos")
	var_Column.FormatColumn = "0 pos ``"
	var_Column.Position = 0
	var_Column.Width = 32
oG2antt.CountLockedColumns = 1
oG2antt.ScrollBars = 2051 /*exVScrollEmptySpace | exBoth*/
oG2antt.Template = [ScrollPos(True) = 10] // oG2antt.ScrollPos(true) = 10
oG2antt.EndUpdate()
|
|
2416
|
Hoist an item, promoting it and all its visible children to the top level
local h1,h2,oG2antt,var_Column,var_Column1,var_Items

oG2antt = form.EXG2ANTTCHARTACTIVEXCONTROL1.nativeObject
oG2antt.BeginUpdate()
oG2antt.LinesAtRoot = -1
var_Column = oG2antt.Columns.Add("P1")
	// var_Column.Def(0) = true
	with (oG2antt)
		TemplateDef = [dim var_Column]
		TemplateDef = var_Column
		Template = [var_Column.Def(0) = True]
	endwith
	var_Column.PartialCheck = true
var_Column1 = oG2antt.Columns.Add("P2")
	// var_Column1.Def(0) = true
	with (oG2antt)
		TemplateDef = [dim var_Column1]
		TemplateDef = var_Column1
		Template = [var_Column1.Def(0) = True]
	endwith
	var_Column1.PartialCheck = true
var_Items = oG2antt.Items
	h1 = var_Items.AddItem("Root 1")
	var_Items.InsertItem(h1,null,"Child 1")
	var_Items.InsertItem(h1,null,"Child 2")
	// var_Items.ExpandItem(h1) = true
	with (oG2antt)
		TemplateDef = [dim var_Items,h1]
		TemplateDef = var_Items
		TemplateDef = h1
		Template = [var_Items.ExpandItem(h1) = True]
	endwith
	h2 = var_Items.AddItem("Root 2")
	var_Items.InsertItem(h2,null,"Child 1")
	var_Items.InsertItem(h2,null,"Child 2")
	var_Items.HoistItem = h1
oG2antt.EndUpdate()
|
|
2415
|
Generates a PDF document on a single A0 page with no margins
local oG2antt,var_Chart,var_CopyTo

oG2antt = form.EXG2ANTTCHARTACTIVEXCONTROL1.nativeObject
oG2antt.BeginUpdate()
oG2antt.LoadXML("C:\Program Files\Exontrol\ExG2antt\Sample\Access\XMLs\datatest.xml")
oG2antt.ColumnAutoResize = false
// oG2antt.Chart.PaneWidth(false) = 196
var_Chart = oG2antt.Chart
with (oG2antt)
	TemplateDef = [dim var_Chart]
	TemplateDef = var_Chart
	Template = [var_Chart.PaneWidth(False) = 196]
endwith
oG2antt.EndUpdate()
var_CopyTo = oG2antt.CopyTo("c:/temp/sample.pdf|33.11 in x 46.81 in|0 0 0 0|single")
|
|
2414
|
Generates a PDF document that scales the content proportionally by 75% using B3 pages (default margins)
local oG2antt,var_Chart,var_CopyTo

oG2antt = form.EXG2ANTTCHARTACTIVEXCONTROL1.nativeObject
oG2antt.BeginUpdate()
oG2antt.LoadXML("C:\Program Files\Exontrol\ExG2antt\Sample\Access\XMLs\datatest.xml")
oG2antt.ColumnAutoResize = false
// oG2antt.Chart.PaneWidth(false) = 196
var_Chart = oG2antt.Chart
with (oG2antt)
	TemplateDef = [dim var_Chart]
	TemplateDef = var_Chart
	Template = [var_Chart.PaneWidth(False) = 196]
endwith
oG2antt.EndUpdate()
var_CopyTo = oG2antt.CopyTo("c:/temp/sample.pdf|6.93 in x 9.84 in||75%")
|
|
2413
|
Generates a PDF document that fits the content exactly to 3 A4 pages wide by 2 pages tall (default margins)
local oG2antt,var_Chart,var_CopyTo

oG2antt = form.EXG2ANTTCHARTACTIVEXCONTROL1.nativeObject
oG2antt.BeginUpdate()
oG2antt.LoadXML("C:\Program Files\Exontrol\ExG2antt\Sample\Access\XMLs\datatest.xml")
oG2antt.ColumnAutoResize = false
// oG2antt.Chart.PaneWidth(false) = 196
var_Chart = oG2antt.Chart
with (oG2antt)
	TemplateDef = [dim var_Chart]
	TemplateDef = var_Chart
	Template = [var_Chart.PaneWidth(False) = 196]
endwith
oG2antt.EndUpdate()
var_CopyTo = oG2antt.CopyTo("c:/temp/sample.pdf|||3 x 2f")
|
|
2412
|
Generates a PDF document that fits the content to 3 A3-landscape pages wide by 2 pages tall (custom margins)
local oG2antt,var_Chart,var_CopyTo

oG2antt = form.EXG2ANTTCHARTACTIVEXCONTROL1.nativeObject
oG2antt.BeginUpdate()
oG2antt.LoadXML("C:\Program Files\Exontrol\ExG2antt\Sample\Access\XMLs\datatest.xml")
oG2antt.ColumnAutoResize = false
// oG2antt.Chart.PaneWidth(false) = 196
var_Chart = oG2antt.Chart
with (oG2antt)
	TemplateDef = [dim var_Chart]
	TemplateDef = var_Chart
	Template = [var_Chart.PaneWidth(False) = 196]
endwith
oG2antt.EndUpdate()
var_CopyTo = oG2antt.CopyTo("c:/temp/sample.pdf|16.54 in x 11.69 in|5 mm 5 mm 5 mm 5 mm|3 x 2")
|
|
2411
|
Generates a PDF document that fits the content to 2 Letter pages tall, automatically determining the number of pages wide (default margins)
local oG2antt,var_Chart,var_CopyTo

oG2antt = form.EXG2ANTTCHARTACTIVEXCONTROL1.nativeObject
oG2antt.BeginUpdate()
oG2antt.LoadXML("C:\Program Files\Exontrol\ExG2antt\Sample\Access\XMLs\datatest.xml")
oG2antt.ColumnAutoResize = false
// oG2antt.Chart.PaneWidth(false) = 196
var_Chart = oG2antt.Chart
with (oG2antt)
	TemplateDef = [dim var_Chart]
	TemplateDef = var_Chart
	Template = [var_Chart.PaneWidth(False) = 196]
endwith
oG2antt.EndUpdate()
var_CopyTo = oG2antt.CopyTo("c:/temp/sample.pdf|8.50 in x 11.00 in||x 2")
|
|
2410
|
Generates a PDF document that fits the content to 1 page wide and as many A4 pages tall as required (default margins)
local oG2antt,var_Chart,var_CopyTo

oG2antt = form.EXG2ANTTCHARTACTIVEXCONTROL1.nativeObject
oG2antt.BeginUpdate()
oG2antt.LoadXML("C:\Program Files\Exontrol\ExG2antt\Sample\Access\XMLs\datatest.xml")
oG2antt.ColumnAutoResize = false
// oG2antt.Chart.PaneWidth(false) = 196
var_Chart = oG2antt.Chart
with (oG2antt)
	TemplateDef = [dim var_Chart]
	TemplateDef = var_Chart
	Template = [var_Chart.PaneWidth(False) = 196]
endwith
oG2antt.EndUpdate()
var_CopyTo = oG2antt.CopyTo("c:/temp/sample.pdf|||1 x")
|
|
2409
|
Generates a PDF document on a single A4 page (default margins)
local oG2antt,var_Chart,var_CopyTo

oG2antt = form.EXG2ANTTCHARTACTIVEXCONTROL1.nativeObject
oG2antt.BeginUpdate()
oG2antt.LoadXML("C:\Program Files\Exontrol\ExG2antt\Sample\Access\XMLs\datatest.xml")
oG2antt.ColumnAutoResize = false
// oG2antt.Chart.PaneWidth(false) = 196
var_Chart = oG2antt.Chart
with (oG2antt)
	TemplateDef = [dim var_Chart]
	TemplateDef = var_Chart
	Template = [var_Chart.PaneWidth(False) = 196]
endwith
oG2antt.EndUpdate()
var_CopyTo = oG2antt.CopyTo("c:/temp/sample.pdf|||single")
|
|
2408
|
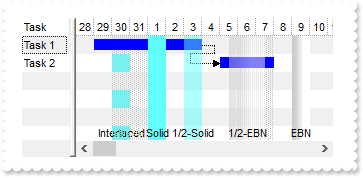
The solid color of MarkTimeZone is interlaced with alternating background rows
local h1,h2,oG2antt,var_Chart,var_Items

oG2antt = form.EXG2ANTTCHARTACTIVEXCONTROL1.nativeObject
oG2antt.BeginUpdate()
oG2antt.BackColorAlternate = 0xf0f0f0
oG2antt.VisualAppearance.Add(1,"gBFLBCJwBAEHhEJAAEhABNEGACAADACAxRDAMgBQKAAzQFAYahqGKGAAGOD4JhUAIIRZGMIjFDcEwxDSMY7jcYJDhEMQ5DREIxDGKEIwqASPJAhFAoJjCMo3RpHYIQSSBUjGOg6TiMUYYfI6DBCEzRUYjNBIUQSQaaZhDCJgYi6OIJP7WLD1XTjES9L5kbBZKw7EqWZpkMraNpWXZjGzdN5nLhuK4mPrWdp2NDeN5NFbjJz8ajAMBaXA8EZbBqHYa2GJYWzOGq1R7IG4yLI2dxVX6XOBmLg5W4WOrHT7QNAcTQ9EafJqnOjqOpaU5WWrXV52NhdbY3PzXNjwbhuLxbXrjZ58ezgHr4J6OEbnRrHchxT58W7nGr9Z6seh6LofFOK5Wmudg7D2LpfHOO5em+dIrBWKplG6PxgjEWZ9DYWxnjKVxvjgXJuHcf4dmqdx9j+YBwBgTAuCMEYLGMGJmEGDxklkRhZhgZoZkYeYhGgWhGhWJxphqOBFi0OoanOLYxDsGwzjmNhtluFphjwbxbncBZDHEXIYhWSw+lyU5xk8P4eAi7ILmMCJGDIdZQhOLRWAAEAQICA=")
oG2antt.Columns.Add("Task")
var_Chart = oG2antt.Chart
	var_Chart.FirstVisibleDate = "12/28/2000"
	// var_Chart.PaneWidth(false) = 48
	with (oG2antt)
		TemplateDef = [dim var_Chart]
		TemplateDef = var_Chart
		Template = [var_Chart.PaneWidth(False) = 48]
	endwith
	var_Chart.AllowLinkBars = false
	var_Chart.AllowCreateBar = 0
	var_Chart.Bars.Item("Task").Pattern = 1
	var_Chart.MarkTimeZone("Z0","12/30/2000","12/31/2000",16777056,";;Interlaced")
	var_Chart.MarkTimeZone("Z1","01/01/2001","01/02/2001",16777056,"1;;Solid")
	var_Chart.MarkTimeZone("Z2","01/03/2001","01/04/2001",16777056,"50;;1/2-Solid")
	var_Chart.MarkTimeZone("Z3","01/05/2001 12:00:00","01/07/2001 12:00:00",16777216,"50;;1/2-EBN")
	var_Chart.MarkTimeZone("Z4","01/09/2001","01/10/2001",16777216,"1;;EBN")
var_Items = oG2antt.Items
	h1 = var_Items.AddItem("Task 1")
	var_Items.AddBar(h1,"Task","12/29/2000","01/04/2001","K1")
	h2 = var_Items.AddItem("Task 2")
	var_Items.AddBar(h2,"Task","01/05/2001","01/08/2001","K2")
	var_Items.AddLink("L1",h1,"K1",h2,"K2")
oG2antt.EndUpdate()
|
|
2407
|
Gets the column from point using ExecuteTemplate method
/*
with (this.EXG2ANTTCHARTACTIVEXCONTROL1.nativeObject)
MouseMove = class::nativeObject_MouseMove
endwith
*/
// Occurs when the user moves the mouse.
function nativeObject_MouseMove(Button, Shift, X, Y)
oG2antt = form.EXG2ANTTCHARTACTIVEXCONTROL1.nativeObject
? Str(oG2antt.ExecuteTemplate("Dim c, hit; c = -1; ItemFromPoint(-1,-1, c, hit ); c"))
return
local h,oG2antt,var_Column,var_Column1,var_Items
oG2antt = form.EXG2ANTTCHARTACTIVEXCONTROL1.nativeObject
oG2antt.BeginUpdate()
oG2antt.LinesAtRoot = -1
oG2antt.DrawGridLines = -2
oG2antt.GridLineStyle = 512
oG2antt.HeaderAppearance = 4
// oG2antt.Columns.Add("P1").Def(0) = true
var_Column = oG2antt.Columns.Add("P1")
with (oG2antt)
TemplateDef = [dim var_Column]
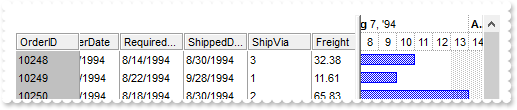
TemplateDef = var_Column
Template = [var_Column.Def(0) = True]
endwith
// oG2antt.Columns.Add("P2").Def(0) = true
var_Column1 = oG2antt.Columns.Add("P2")
with (oG2antt)
TemplateDef = [dim var_Column1]
TemplateDef = var_Column1
Template = [var_Column1.Def(0) = True]
endwith
var_Items = oG2antt.Items
h = var_Items.AddItem("Root")
var_Items.InsertItem(h,null,"Child 1")
var_Items.InsertItem(h,null,"Child 2")
// var_Items.ExpandItem(h) = true
with (oG2antt)
TemplateDef = [dim var_Items,h]
TemplateDef = var_Items
TemplateDef = h
Template = [var_Items.ExpandItem(h) = True]
endwith
oG2antt.EndUpdate()
|
|
2406
|
Gets the item from point using ExecuteTemplate method
/*
with (this.EXG2ANTTCHARTACTIVEXCONTROL1.nativeObject)
	MouseMove = class::nativeObject_MouseMove
endwith
*/
// Occurs when the user moves the mouse.
function nativeObject_MouseMove(Button, Shift, X, Y)
	oG2antt = form.EXG2ANTTCHARTACTIVEXCONTROL1.nativeObject
	? Str(oG2antt.ExecuteTemplate("Dim c, hit; ItemFromPoint(-1,-1, c, hit )"))
return

local h,oG2antt,var_Column,var_Column1,var_Items

oG2antt = form.EXG2ANTTCHARTACTIVEXCONTROL1.nativeObject
oG2antt.BeginUpdate()
oG2antt.LinesAtRoot = -1
oG2antt.DrawGridLines = -2
oG2antt.GridLineStyle = 512
oG2antt.HeaderAppearance = 4
// oG2antt.Columns.Add("P1").Def(0) = true
var_Column = oG2antt.Columns.Add("P1")
with (oG2antt)
	TemplateDef = [dim var_Column]
	TemplateDef = var_Column
	Template = [var_Column.Def(0) = True]
endwith
// oG2antt.Columns.Add("P2").Def(0) = true
var_Column1 = oG2antt.Columns.Add("P2")
with (oG2antt)
	TemplateDef = [dim var_Column1]
	TemplateDef = var_Column1
	Template = [var_Column1.Def(0) = True]
endwith
var_Items = oG2antt.Items
	h = var_Items.AddItem("Root")
	var_Items.InsertItem(h,null,"Child 1")
	var_Items.InsertItem(h,null,"Child 2")
	// var_Items.ExpandItem(h) = true
	with (oG2antt)
		TemplateDef = [dim var_Items,h]
		TemplateDef = var_Items
		TemplateDef = h
		Template = [var_Items.ExpandItem(h) = True]
	endwith
oG2antt.EndUpdate()
|
|
2405
|
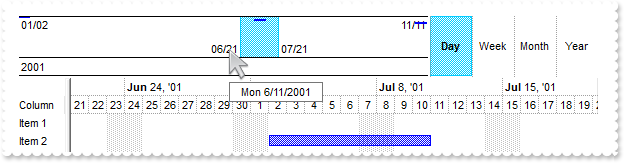
Define the appearance to display margin-dates into the overview
local oG2antt,var_Chart,var_Items

oG2antt = form.EXG2ANTTCHARTACTIVEXCONTROL1.nativeObject
oG2antt.BeginUpdate()
var_Chart = oG2antt.Chart
	var_Chart.FirstVisibleDate = "06/21/2001"
	// var_Chart.PaneWidth(false) = 48
	with (oG2antt)
		TemplateDef = [dim var_Chart]
		TemplateDef = var_Chart
		Template = [var_Chart.PaneWidth(False) = 48]
	endwith
	var_Chart.OverviewVisible = 31746 /*0x400 | exOverviewShowSelMargins | exOverviewShowMargins | exOverviewShowDateTimeScaleBottom | exOverviewShowAllVisible*/
	var_Chart.OverviewHeight = 64
	var_Chart.OverviewMarginsFormat = "(margin < 2 ? `<fgcolor gray>` : `<b>`) + shortdate(value)"
	var_Chart.LevelCount = 2
	// var_Chart.Label(65536) = ""
	with (oG2antt)
		TemplateDef = [dim var_Chart]
		TemplateDef = var_Chart
		Template = [var_Chart.Label(65536) = ""]
	endwith
	// var_Chart.Label(1048576) = ""
	with (oG2antt)
		TemplateDef = [dim var_Chart]
		TemplateDef = var_Chart
		Template = [var_Chart.Label(1048576) = ""]
	endwith
	// var_Chart.Label(16777216) = ""
	with (oG2antt)
		TemplateDef = [dim var_Chart]
		TemplateDef = var_Chart
		Template = [var_Chart.Label(16777216) = ""]
	endwith
	var_Chart.AllowOverviewZoom = 1
oG2antt.Columns.Add("Column")
var_Items = oG2antt.Items
	var_Items.AddBar(var_Items.AddItem("Item 1"),"Task","01/02/2001","01/11/2001")
	var_Items.AddBar(var_Items.AddItem("Item 2"),"Task","07/02/2001","07/11/2001")
	var_Items.AddBar(var_Items.AddItem("Item 3"),"Task","11/02/2001","11/11/2001")
oG2antt.EndUpdate()
|
|
2404
|
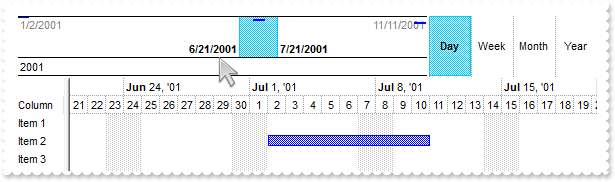
Define the format to display margin-dates into the overview
local oG2antt,var_Chart,var_Items

oG2antt = form.EXG2ANTTCHARTACTIVEXCONTROL1.nativeObject
oG2antt.BeginUpdate()
var_Chart = oG2antt.Chart
	var_Chart.FirstVisibleDate = "06/21/2001"
	// var_Chart.PaneWidth(false) = 48
	with (oG2antt)
		TemplateDef = [dim var_Chart]
		TemplateDef = var_Chart
		Template = [var_Chart.PaneWidth(False) = 48]
	endwith
	var_Chart.OverviewVisible = 31746 /*0x400 | exOverviewShowSelMargins | exOverviewShowMargins | exOverviewShowDateTimeScaleBottom | exOverviewShowAllVisible*/
	var_Chart.OverviewHeight = 64
	var_Chart.OverviewMarginsFormat = "value format `MM/dd`"
	var_Chart.LevelCount = 2
	// var_Chart.Label(65536) = ""
	with (oG2antt)
		TemplateDef = [dim var_Chart]
		TemplateDef = var_Chart
		Template = [var_Chart.Label(65536) = ""]
	endwith
	// var_Chart.Label(1048576) = ""
	with (oG2antt)
		TemplateDef = [dim var_Chart]
		TemplateDef = var_Chart
		Template = [var_Chart.Label(1048576) = ""]
	endwith
	// var_Chart.Label(16777216) = ""
	with (oG2antt)
		TemplateDef = [dim var_Chart]
		TemplateDef = var_Chart
		Template = [var_Chart.Label(16777216) = ""]
	endwith
	var_Chart.AllowOverviewZoom = 1
oG2antt.Columns.Add("Column")
var_Items = oG2antt.Items
	var_Items.AddBar(var_Items.AddItem("Item 1"),"Task","01/02/2001","01/11/2001")
	var_Items.AddBar(var_Items.AddItem("Item 2"),"Task","07/02/2001","07/11/2001")
	var_Items.AddBar(var_Items.AddItem("Item 3"),"Task","11/02/2001","11/11/2001")
oG2antt.EndUpdate()
|
|
2403
|
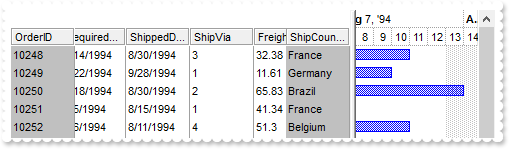
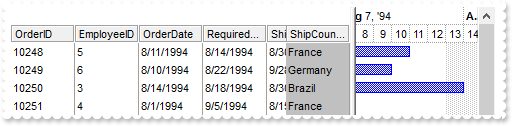
Locks the first visible column on the left and the last visible column on the right
/*
with (this.EXG2ANTTCHARTACTIVEXCONTROL1.nativeObject)
	AddItem = class::nativeObject_AddItem
endwith
*/
// Occurs after a new Item has been inserted to Items collection.
function nativeObject_AddItem(Item)
	local var_Items
	oG2antt = form.EXG2ANTTCHARTACTIVEXCONTROL1.nativeObject
	var_Items = oG2antt.Items
		var_Items.AddBar(Item,"Task",var_Items.CellValue(Item,1),var_Items.CellValue(Item,2))
return

local oG2antt,rs,var_Chart

oG2antt = form.EXG2ANTTCHARTACTIVEXCONTROL1.nativeObject
oG2antt.BeginUpdate()
var_Chart = oG2antt.Chart
	var_Chart.FirstVisibleDate = "08/08/1994"
	var_Chart.LevelCount = 2
oG2antt.ColumnAutoResize = false
oG2antt.BackColorLock = 0xc0c0c0
oG2antt.GridLineStyle = 48
oG2antt.DrawGridLines = 2
oG2antt.HeaderAppearance = 4
rs = new OleAutoClient("ADOR.Recordset")
	rs.Open("Orders","Provider=Microsoft.ACE.OLEDB.12.0;Data Source=C:\Program Files\Exontrol\ExG2antt\Sample\Access\misc.mdb",3,3)
oG2antt.DataSource = rs
oG2antt.CountLockedColumns = 17
oG2antt.EndUpdate()
|
|
2402
|
Lock the column on the right
/*
with (this.EXG2ANTTCHARTACTIVEXCONTROL1.nativeObject)
	AddItem = class::nativeObject_AddItem
endwith
*/
// Occurs after a new Item has been inserted to Items collection.
function nativeObject_AddItem(Item)
	local var_Items
	oG2antt = form.EXG2ANTTCHARTACTIVEXCONTROL1.nativeObject
	var_Items = oG2antt.Items
		var_Items.AddBar(Item,"Task",var_Items.CellValue(Item,1),var_Items.CellValue(Item,2))
return

local oG2antt,rs,var_Chart

oG2antt = form.EXG2ANTTCHARTACTIVEXCONTROL1.nativeObject
oG2antt.BeginUpdate()
var_Chart = oG2antt.Chart
	var_Chart.FirstVisibleDate = "08/08/1994"
	var_Chart.LevelCount = 2
oG2antt.ColumnAutoResize = false
oG2antt.BackColorLock = 0xc0c0c0
oG2antt.GridLineStyle = 48
oG2antt.DrawGridLines = 2
oG2antt.HeaderAppearance = 4
rs = new OleAutoClient("ADOR.Recordset")
	rs.Open("Orders","Provider=Microsoft.ACE.OLEDB.12.0;Data Source=C:\Program Files\Exontrol\ExG2antt\Sample\Access\misc.mdb",3,3)
oG2antt.DataSource = rs
oG2antt.CountLockedColumns = 16
oG2antt.EndUpdate()
|
|
2401
|
Lock the column on the left
/*
with (this.EXG2ANTTCHARTACTIVEXCONTROL1.nativeObject)
	AddItem = class::nativeObject_AddItem
endwith
*/
// Occurs after a new Item has been inserted to Items collection.
function nativeObject_AddItem(Item)
	local var_Items
	oG2antt = form.EXG2ANTTCHARTACTIVEXCONTROL1.nativeObject
	var_Items = oG2antt.Items
		var_Items.AddBar(Item,"Task",var_Items.CellValue(Item,1),var_Items.CellValue(Item,2))
return

local oG2antt,rs,var_Chart

oG2antt = form.EXG2ANTTCHARTACTIVEXCONTROL1.nativeObject
oG2antt.BeginUpdate()
var_Chart = oG2antt.Chart
	var_Chart.FirstVisibleDate = "08/08/1994"
	var_Chart.LevelCount = 2
oG2antt.ColumnAutoResize = false
oG2antt.BackColorLock = 0xc0c0c0
oG2antt.GridLineStyle = 48
oG2antt.DrawGridLines = 2
oG2antt.HeaderAppearance = 4
rs = new OleAutoClient("ADOR.Recordset")
	rs.Open("Orders","Provider=Microsoft.ACE.OLEDB.12.0;Data Source=C:\Program Files\Exontrol\ExG2antt\Sample\Access\misc.mdb",3,3)
oG2antt.DataSource = rs
oG2antt.CountLockedColumns = 1
oG2antt.EndUpdate()
|
|
2400
|
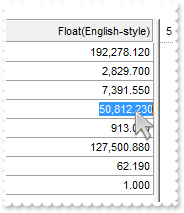
Mask for Floating-Point Numbers (Emglish Style: . as Decimal, , as Grouping Separator)
local oG2antt,var_Column,var_Editor,var_Items

oG2antt = form.EXG2ANTTCHARTACTIVEXCONTROL1.nativeObject
oG2antt.BeginUpdate()
oG2antt.HeaderAppearance = 4
oG2antt.HeaderHeight = 24
oG2antt.DrawGridLines = -2
oG2antt.GridLineStyle = 48
oG2antt.SelForeColor = oG2antt.ForeColor
oG2antt.SelBackColor = oG2antt.BackColor
oG2antt.ShowFocusRect = false
var_Column = oG2antt.Columns.Add("Float(English-style)")
	var_Column.SortType = 1
	var_Column.FormatColumn = "value format `3`"
	var_Column.HeaderAlignment = 2
	var_Column.Alignment = 2
	var_Editor = var_Column.Editor
		var_Editor.EditType = 8
		var_Editor.Mask = "!999,999,990.000;;;float,right,negative,grouping=\,,decimal=."
var_Items = oG2antt.Items
	var_Items.AddItem(192278.12)
	var_Items.AddItem(2829.7)
	var_Items.AddItem(7391.55)
	var_Items.AddItem(50812.23)
	var_Items.AddItem(913.04)
	var_Items.AddItem(127500.88)
	var_Items.AddItem(62.19)
	var_Items.AddItem(1)
oG2antt.EndUpdate()
|
|
2399
|
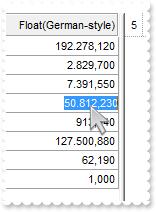
Mask for Floating-Point Numbers (German Style: , as Decimal, . as Grouping Separator)
local oG2antt,var_Column,var_Editor,var_Items

oG2antt = form.EXG2ANTTCHARTACTIVEXCONTROL1.nativeObject
oG2antt.BeginUpdate()
oG2antt.HeaderAppearance = 4
oG2antt.HeaderHeight = 24
oG2antt.DrawGridLines = -2
oG2antt.GridLineStyle = 48
oG2antt.SelForeColor = oG2antt.ForeColor
oG2antt.SelBackColor = oG2antt.BackColor
oG2antt.ShowFocusRect = false
var_Column = oG2antt.Columns.Add("Float(German-style)")
	var_Column.SortType = 1
	var_Column.FormatColumn = "value format `3`"
	var_Column.HeaderAlignment = 2
	var_Column.Alignment = 2
	var_Editor = var_Column.Editor
		var_Editor.EditType = 8
		var_Editor.Mask = "!999.999.990,000;;;float,right,grouping=.,decimal=\,"
var_Items = oG2antt.Items
	var_Items.AddItem(192278.12)
	var_Items.AddItem(2829.7)
	var_Items.AddItem(7391.55)
	var_Items.AddItem(50812.23)
	var_Items.AddItem(913.04)
	var_Items.AddItem(127500.88)
	var_Items.AddItem(62.19)
	var_Items.AddItem(1)
oG2antt.EndUpdate()
|
|
2398
|
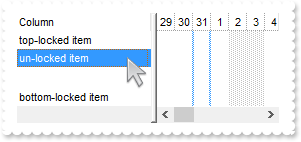
Update the item's lock state - pinning it to the top, bottom, or making it scrollable
local oG2antt,var_Items

oG2antt = form.EXG2ANTTCHARTACTIVEXCONTROL1.nativeObject
oG2antt.BeginUpdate()
oG2antt.Columns.Add("Column")
var_Items = oG2antt.Items
	var_Items.AddItem("un-locked item")
	// var_Items.LockItem(var_Items.AddItem("top-locked item")) = -1
	with (oG2antt)
		TemplateDef = [dim var_Items]
		TemplateDef = var_Items
		Template = [var_Items.LockItem(AddItem("top-locked item")) = -1]
	endwith
	// var_Items.LockItem(var_Items.AddItem("bottom-locked item")) = 1
	with (oG2antt)
		TemplateDef = [dim var_Items]
		TemplateDef = var_Items
		Template = [var_Items.LockItem(AddItem("bottom-locked item")) = 1]
	endwith
oG2antt.EndUpdate()
|
|
2397
|
Is it possible to extend the HotBackColor property to the chart section, so that an item is highlighted when the cursor hovers over it
local oG2antt,var_Bar,var_Chart,var_Items

oG2antt = form.EXG2ANTTCHARTACTIVEXCONTROL1.nativeObject
oG2antt.BeginUpdate()
oG2antt.Columns.Add("Def")
oG2antt.HotBackColor = 0xffb66b
oG2antt.HotForeColor = 0xffffff
oG2antt.Template = [Background(188) = 65536] // oG2antt.Background(188) = 0x10000
var_Chart = oG2antt.Chart
	var_Chart.LevelCount = 2
	// var_Chart.PaneWidth(false) = 128
	with (oG2antt)
		TemplateDef = [dim var_Chart]
		TemplateDef = var_Chart
		Template = [var_Chart.PaneWidth(False) = 128]
	endwith
	var_Chart.SelBackColor = oG2antt.SelBackColor
	var_Chart.HotBackColor = oG2antt.HotBackColor
	var_Chart.HotForeColor = oG2antt.HotForeColor
	var_Chart.AllowCreateBar = 1
	var_Bar = var_Chart.Bars.Item("Task")
		var_Bar.Color = 0x0
		var_Bar.Pattern = 1
var_Items = oG2antt.Items
	var_Items.AddItem("Item A")
	var_Items.AddItem("Item B")
	var_Items.AddItem("Item C")
oG2antt.EndUpdate()
|
|
2396
|
The Change event is called before changing the value. Is there any event such as Changed that is called after updating the cell's value
/*
with (this.EXG2ANTTCHARTACTIVEXCONTROL1.nativeObject)
	Changed = class::nativeObject_Changed
endwith
*/
// Occurs after the user has changed the content of a cell.
function nativeObject_Changed(Item, ColIndex)
	oG2antt = form.EXG2ANTTCHARTACTIVEXCONTROL1.nativeObject
	? Str(oG2antt.Items.CellValue(Item,ColIndex))
return

local oG2antt,var_Chart,var_Editor

oG2antt = form.EXG2ANTTCHARTACTIVEXCONTROL1.nativeObject
oG2antt.BeginUpdate()
// oG2antt.Chart.PaneWidth(true) = 0
var_Chart = oG2antt.Chart
with (oG2antt)
	TemplateDef = [dim var_Chart]
	TemplateDef = var_Chart
	Template = [var_Chart.PaneWidth(True) = 0]
endwith
// oG2antt.Columns.Add("Edit").Editor.EditType = 1
var_Editor = oG2antt.Columns.Add("Edit").Editor
with (oG2antt)
	TemplateDef = [dim var_Editor]
	TemplateDef = var_Editor
	Template = [var_Editor.EditType = 1]
endwith
oG2antt.Items.AddItem("Item 1")
oG2antt.Items.AddItem("Item 2")
oG2antt.EndUpdate()
|
|
2395
|
How can I reposition the +/- (expand/collapse) icon to show as "number, icon, text" (sample 2)
/*
with (this.EXG2ANTTCHARTACTIVEXCONTROL1.nativeObject)
	AnchorClick = class::nativeObject_AnchorClick
endwith
*/
// Occurs when an anchor element is clicked.
function nativeObject_AnchorClick(AnchorID, Options)
	local exp,i,var_Items
	oG2antt = form.EXG2ANTTCHARTACTIVEXCONTROL1.nativeObject
	i = oG2antt.FormatABC("int(value)",AnchorID)
	var_Items = oG2antt.Items
		i = var_Items.ItemByIndex(i)
		exp = var_Items.ExpandItem(i)
		// var_Items.ExpandItem(i) = false
		with (oG2antt)
			TemplateDef = [dim var_Items,i]
			TemplateDef = var_Items
			TemplateDef = i
			Template = [var_Items.ExpandItem(i) = Me.FormatABC("not value",exp)]
		endwith
return

local h,hRoot,oG2antt,var_Column,var_Columns,var_Items

oG2antt = form.EXG2ANTTCHARTACTIVEXCONTROL1.nativeObject
oG2antt.BeginUpdate()
oG2antt.Template = [HTMLPicture("expand") = "gCJKBOI4NBQaBQAhQNJJIIhShQACERCAIA0RD7zf5hiIBOZSI5CACuZwcdMRAhnIJNIMKWKPBb8MIFiIJOBILJzhQOYc7YYBY5vVBkiIYOhFLB0KZvMx0O5hORlABQMJpNx0FxOIpUEA1FwxFw3RbWe45iK2MpYJJmJJJFQABERmgaAM0AMRJURDd1AF3hUQhQoAIDvsRAURGIBw8ThRaiJpQ4EwsKNURyxgjsRzEKv1TqtXrNbrtfsIAwgASAHAGShQwGQzGABUGEzudAqgyWdSmWw2Fw+sABSHI4AGH1XAGAxGAwywlI6eRqjGi1YuaJJEIJUHBPYqSJYKQAwCBDKbBPbncBibrUKQjGLFQo+TBFfR5GaUAR/KbGICyRxsiCOQClgdJxGoMpkGycpdDqUZ0EoJQJHYVoWCSCA4kEbRlHKRwJiYcYCH0PBNB2JwYCaCRsGcE8LDyfZKg+U59EsAZMlQCgJkcEA9CsywkiKJwiFcIQwEEgI="] // oG2antt.HTMLPicture("expand") = "gCJKBOI4NBQaBQAhQNJJIIhShQACERCAIA0RD7zf5hiIBOZSI5CACuZwcdMRAhnIJNIMKWKPBb8MIFiIJOBILJzhQOYc7YYBY5vVBkiIYOhFLB0KZvMx0O5hORlABQMJpNx0FxOIpUEA1FwxFw3RbWe45iK2MpYJJmJJJFQABERmgaAM0AMRJURDd1AF3hUQhQoAIDvsRAURGIBw8ThRaiJpQ4EwsKNURyxgjsRzEKv1TqtXrNbrtfsIAwgASAHAGShQwGQzGABUGEzudAqgyWdSmWw2Fw+sABSHI4AGH1XAGAxGAwywlI6eRqjGi1YuaJJEIJUHBPYqSJYKQAwCBDKbBPbncBibrUKQjGLFQo+TBFfR5GaUAR/KbGICyRxsiCOQClgdJxGoMpkGycpdDqUZ0EoJQJHYVoWCSCA4kEbRlHKRwJiYcYCH0PBNB2JwYCaCRsGcE8LDyfZKg+U59EsAZMlQCgJkcEA9CsywkiKJwiFcIQwEEgI="
oG2antt.Template = [HTMLPicture("collapse") = "gCJKBOI4NBQaBQAhQNJJIIhShQACERCAIA0RD7zf5hiIBOZSI5CACuZwcdMRAhnIJNIMKWKPBb8MIFiIJOBILJzhQOYU7YQBCooJSAiIYOhFLB0KZvMx0O5hORlABQMJpNx0FxOIpUEA1FwxFw3RbWe45iK2MpYJJmJJJFQABERmgaAM0AMRJURDd1AF3hUQhQoAIDvsRAURGIBw8ThRaiJpQ4EwsKNURyzyO13dGEAGYzWcqlWrFarlesA3AGcSAHAGShQwGQzGABUGEv2TAAFUGS26Uy2GwuH1wAKQ5HAAw+s4YwGIwGGWISpVLiXT5MrxiJyJJEIJUHBPYqSXYOQAgBgAB6jJwufxxX7YYhdYhFCSsSwSC4uMLoQajNJAG8QgZAgSIqGMCwRBkAJDicGwuiMeoHGeaRFlAU5qDwQQ6A+CYnlgPQeisGJfl4AJYhsRISjQYwJHIcpmmALAtlMEpkE4YBREmEpPBAARdicSw8AES5fi+fI5g+PpcAAUJKgyCYknaZRrssJIiicIhXCEMBBICA=="] // oG2antt.HTMLPicture("collapse") = "gCJKBOI4NBQaBQAhQNJJIIhShQACERCAIA0RD7zf5hiIBOZSI5CACuZwcdMRAhnIJNIMKWKPBb8MIFiIJOBILJzhQOYU7YQBCooJSAiIYOhFLB0KZvMx0O5hORlABQMJpNx0FxOIpUEA1FwxFw3RbWe45iK2MpYJJmJJJFQABERmgaAM0AMRJURDd1AF3hUQhQoAIDvsRAURGIBw8ThRaiJpQ4EwsKNURyzyO13dGEAGYzWcqlWrFarlesA3AGcSAHAGShQwGQzGABUGEv2TAAFUGS26Uy2GwuH1wAKQ5HAAw+s4YwGIwGGWISpVLiXT5MrxiJyJJEIJUHBPYqSXYOQAgBgAB6jJwufxxX7YYhdYhFCSsSwSC4uMLoQajNJAG8QgZAgSIqGMCwRBkAJDicGwuiMeoHGeaRFlAU5qDwQQ6A+CYnlgPQeisGJfl4AJYhsRISjQYwJHIcpmmALAtlMEpkE4YBREmEpPBAARdicSw8AES5fi+fI5g+PpcAAUJKgyCYknaZRrssJIiicIhXCEMBBICA=="
oG2antt.HeaderVisible = false
oG2antt.HasLines = 0
oG2antt.HasButtons = 0
oG2antt.Indent = 12
oG2antt.DefaultItemHeight = 24
oG2antt.DrawGridLines = 1
oG2antt.GridLineStyle = 48
oG2antt.GridLineColor = 0xcccccc
oG2antt.ShowFocusRect = false
oG2antt.ExpandOnDblClick = false
oG2antt.ExpandOnKeys = false
var_Columns = oG2antt.Columns
	var_Column = var_Columns.Add("Item")
		// var_Column.Def(17) = 1
		with (oG2antt)
			TemplateDef = [dim var_Column]
			TemplateDef = var_Column
			Template = [var_Column.Def(17) = 1]
		endwith
		var_Column.FormatColumn = "(len(parent(1 index ``)) ? (`<b><fgcolor gray>` + (1 pos ``) + `. ` + `</fgcolor></b>` + `<a ` + (0 index ``) + `><img>` + (%CC0 ? (not %CX0 ? `expand` : `collapse`) : ``) + `:16</img></a>`) : ``) + ` ` + value"
var_Items = oG2antt.Items
	hRoot = var_Items.AddItem("ACME Corporation")
	// var_Items.SelectableItem(hRoot) = false
	with (oG2antt)
		TemplateDef = [dim var_Items,hRoot]
		TemplateDef = var_Items
		TemplateDef = hRoot
		Template = [var_Items.SelectableItem(hRoot) = False]
	endwith
	// var_Items.ExpandItem(hRoot) = true
	with (oG2antt)
		TemplateDef = [dim var_Items,hRoot]
		TemplateDef = var_Items
		TemplateDef = hRoot
		Template = [var_Items.ExpandItem(hRoot) = True]
	endwith
	h = var_Items.InsertItem(hRoot,null,"Management")
	var_Items.InsertItem(h,null,"CEO - Alice Brown")
	var_Items.InsertItem(h,null,"COO - James Lee")
	h = var_Items.InsertItem(hRoot,null,"HR Department")
	var_Items.InsertItem(h,null,"Recruiter - Jane Smith")
	var_Items.InsertItem(h,null,"HR Assistant - Bob Green")
	// var_Items.ExpandItem(h) = true
	with (oG2antt)
		TemplateDef = [dim var_Items,h]
		TemplateDef = var_Items
		TemplateDef = h
		Template = [var_Items.ExpandItem(h) = True]
	endwith
	h = var_Items.InsertItem(h,null,"Engineering")
	var_Items.InsertItem(h,null,"Software Team")
	h = var_Items.InsertItem(h,null,"Lead Developer - Mark H.")
	var_Items.InsertItem(h,null,"Frontend Dev - Emily R.")
	var_Items.InsertItem(h,null,"Backend Dev - Tom W.")
	var_Items.InsertItem(hRoot,null,"QA Team")
oG2antt.EndUpdate()
|
|
2394
|
How can I reposition the +/- (expand/collapse) icon to show as "number, icon, text" (sample 1)

/*
with (this.EXG2ANTTCHARTACTIVEXCONTROL1.nativeObject)
	AnchorClick = class::nativeObject_AnchorClick
endwith
*/
// Occurs when an anchor element is clicked.
function nativeObject_AnchorClick(AnchorID, Options)
	local exp,i,var_Items
	oG2antt = form.EXG2ANTTCHARTACTIVEXCONTROL1.nativeObject
	i = oG2antt.FormatABC("int(value)",AnchorID)
	var_Items = oG2antt.Items
		i = var_Items.ItemByIndex(i)
		exp = var_Items.ExpandItem(i)
		// var_Items.ExpandItem(i) = false
		with (oG2antt)
			TemplateDef = [dim var_Items,i]
			TemplateDef = var_Items
			TemplateDef = i
			Template = [var_Items.ExpandItem(i) = Me.FormatABC("not value",exp)]
		endwith
return

local h,hRoot,oG2antt,var_Column,var_Columns,var_Items

oG2antt = form.EXG2ANTTCHARTACTIVEXCONTROL1.nativeObject
oG2antt.BeginUpdate()
oG2antt.Template = [HTMLPicture("expand") = "gCJKBOI4NBQaBQAhQNJJIIhShQACERCAIA0RD7zf5hiIBOZSI5CACuZwcdMRAhnIJNIMKWKPBb8MIFiIJOBILJzhQOYc7YYBY5vVBkiIYOhFLB0KZvMx0O5hORlABQMJpNx0FxOIpUEA1FwxFw3RbWe45iK2MpYJJmJJJFQABERmgaAM0AMRJURDd1AF3hUQhQoAIDvsRAURGIBw8ThRaiJpQ4EwsKNURyxgjsRzEKv1TqtXrNbrtfsIAwgASAHAGShQwGQzGABUGEzudAqgyWdSmWw2Fw+sABSHI4AGH1XAGAxGAwywlI6eRqjGi1YuaJJEIJUHBPYqSJYKQAwCBDKbBPbncBibrUKQjGLFQo+TBFfR5GaUAR/KbGICyRxsiCOQClgdJxGoMpkGycpdDqUZ0EoJQJHYVoWCSCA4kEbRlHKRwJiYcYCH0PBNB2JwYCaCRsGcE8LDyfZKg+U59EsAZMlQCgJkcEA9CsywkiKJwiFcIQwEEgI="] // oG2antt.HTMLPicture("expand") = "gCJKBOI4NBQaBQAhQNJJIIhShQACERCAIA0RD7zf5hiIBOZSI5CACuZwcdMRAhnIJNIMKWKPBb8MIFiIJOBILJzhQOYc7YYBY5vVBkiIYOhFLB0KZvMx0O5hORlABQMJpNx0FxOIpUEA1FwxFw3RbWe45iK2MpYJJmJJJFQABERmgaAM0AMRJURDd1AF3hUQhQoAIDvsRAURGIBw8ThRaiJpQ4EwsKNURyxgjsRzEKv1TqtXrNbrtfsIAwgASAHAGShQwGQzGABUGEzudAqgyWdSmWw2Fw+sABSHI4AGH1XAGAxGAwywlI6eRqjGi1YuaJJEIJUHBPYqSJYKQAwCBDKbBPbncBibrUKQjGLFQo+TBFfR5GaUAR/KbGICyRxsiCOQClgdJxGoMpkGycpdDqUZ0EoJQJHYVoWCSCA4kEbRlHKRwJiYcYCH0PBNB2JwYCaCRsGcE8LDyfZKg+U59EsAZMlQCgJkcEA9CsywkiKJwiFcIQwEEgI="
oG2antt.Template = [HTMLPicture("collapse") = "gCJKBOI4NBQaBQAhQNJJIIhShQACERCAIA0RD7zf5hiIBOZSI5CACuZwcdMRAhnIJNIMKWKPBb8MIFiIJOBILJzhQOYU7YQBCooJSAiIYOhFLB0KZvMx0O5hORlABQMJpNx0FxOIpUEA1FwxFw3RbWe45iK2MpYJJmJJJFQABERmgaAM0AMRJURDd1AF3hUQhQoAIDvsRAURGIBw8ThRaiJpQ4EwsKNURyzyO13dGEAGYzWcqlWrFarlesA3AGcSAHAGShQwGQzGABUGEv2TAAFUGS26Uy2GwuH1wAKQ5HAAw+s4YwGIwGGWISpVLiXT5MrxiJyJJEIJUHBPYqSXYOQAgBgAB6jJwufxxX7YYhdYhFCSsSwSC4uMLoQajNJAG8QgZAgSIqGMCwRBkAJDicGwuiMeoHGeaRFlAU5qDwQQ6A+CYnlgPQeisGJfl4AJYhsRISjQYwJHIcpmmALAtlMEpkE4YBREmEpPBAARdicSw8AES5fi+fI5g+PpcAAUJKgyCYknaZRrssJIiicIhXCEMBBICA=="] // oG2antt.HTMLPicture("collapse") = "gCJKBOI4NBQaBQAhQNJJIIhShQACERCAIA0RD7zf5hiIBOZSI5CACuZwcdMRAhnIJNIMKWKPBb8MIFiIJOBILJzhQOYU7YQBCooJSAiIYOhFLB0KZvMx0O5hORlABQMJpNx0FxOIpUEA1FwxFw3RbWe45iK2MpYJJmJJJFQABERmgaAM0AMRJURDd1AF3hUQhQoAIDvsRAURGIBw8ThRaiJpQ4EwsKNURyzyO13dGEAGYzWcqlWrFarlesA3AGcSAHAGShQwGQzGABUGEv2TAAFUGS26Uy2GwuH1wAKQ5HAAw+s4YwGIwGGWISpVLiXT5MrxiJyJJEIJUHBPYqSXYOQAgBgAB6jJwufxxX7YYhdYhFCSsSwSC4uMLoQajNJAG8QgZAgSIqGMCwRBkAJDicGwuiMeoHGeaRFlAU5qDwQQ6A+CYnlgPQeisGJfl4AJYhsRISjQYwJHIcpmmALAtlMEpkE4YBREmEpPBAARdicSw8AES5fi+fI5g+PpcAAUJKgyCYknaZRrssJIiicIhXCEMBBICA=="
oG2antt.HeaderVisible = false
oG2antt.HasLines = 0
oG2antt.HasButtons = 0
oG2antt.Indent = 12
oG2antt.DefaultItemHeight = 24
oG2antt.DrawGridLines = 1
oG2antt.GridLineStyle = 48
oG2antt.GridLineColor = 0xcccccc
oG2antt.ShowFocusRect = false
oG2antt.ExpandOnDblClick = false
oG2antt.ExpandOnKeys = false
var_Columns = oG2antt.Columns
	var_Column = var_Columns.Add("Item")
		// var_Column.Def(17) = 1
		with (oG2antt)
			TemplateDef = [dim var_Column]
			TemplateDef = var_Column
			Template = [var_Column.Def(17) = 1]
		endwith
		var_Column.FormatColumn = "(len(parent(1 index ``)) ? (`<b><fgcolor gray>` + (1 pos ``) + `. ` + `</fgcolor></b>` + `<a ` + (0 index ``) + `><img>` + (%CC0 ? (not %CX0 ? `expand` : `collapse`) : ``) + `:16</img></a>`) : ``) + ` ` + value"
var_Items = oG2antt.Items
	hRoot = var_Items.AddItem("ACME Corporation")
	// var_Items.SelectableItem(hRoot) = false
	with (oG2antt)
		TemplateDef = [dim var_Items,hRoot]
		TemplateDef = var_Items
		TemplateDef = hRoot
		Template = [var_Items.SelectableItem(hRoot) = False]
	endwith
	// var_Items.ExpandItem(hRoot) = true
	with (oG2antt)
		TemplateDef = [dim var_Items,hRoot]
		TemplateDef = var_Items
		TemplateDef = hRoot
		Template = [var_Items.ExpandItem(hRoot) = True]
	endwith
	h = var_Items.InsertItem(hRoot,null,"Management")
	var_Items.InsertItem(h,null,"CEO - Alice Brown")
	var_Items.InsertItem(h,null,"COO - James Lee")
	h = var_Items.InsertItem(hRoot,null,"HR Department")
	var_Items.InsertItem(h,null,"Recruiter - Jane Smith")
	var_Items.InsertItem(h,null,"HR Assistant - Bob Green")
	// var_Items.ExpandItem(h) = true
	with (oG2antt)
		TemplateDef = [dim var_Items,h]
		TemplateDef = var_Items
		TemplateDef = h
		Template = [var_Items.ExpandItem(h) = True]
	endwith
	h = var_Items.InsertItem(h,null,"Engineering")
	var_Items.InsertItem(h,null,"Software Team")
	h = var_Items.InsertItem(h,null,"Lead Developer - Mark H.")
	var_Items.InsertItem(h,null,"Frontend Dev - Emily R.")
	var_Items.InsertItem(h,null,"Backend Dev - Tom W.")
	var_Items.InsertItem(hRoot,null,"QA Team")
oG2antt.EndUpdate()
|
|
2393
|
Expandable bullet list

/*
with (this.EXG2ANTTCHARTACTIVEXCONTROL1.nativeObject)
	AnchorClick = class::nativeObject_AnchorClick
endwith
*/
// Occurs when an anchor element is clicked.
function nativeObject_AnchorClick(AnchorID, Options)
	local exp,i,var_Items
	oG2antt = form.EXG2ANTTCHARTACTIVEXCONTROL1.nativeObject
	i = oG2antt.FormatABC("int(value)",AnchorID)
	var_Items = oG2antt.Items
		i = var_Items.ItemByIndex(i)
		exp = var_Items.ExpandItem(i)
		// var_Items.ExpandItem(i) = false
		with (oG2antt)
			TemplateDef = [dim var_Items,i]
			TemplateDef = var_Items
			TemplateDef = i
			Template = [var_Items.ExpandItem(i) = Me.FormatABC("not value",exp)]
		endwith
return

local h,hRoot,oG2antt,var_Column,var_Columns,var_Editor,var_Items

oG2antt = form.EXG2ANTTCHARTACTIVEXCONTROL1.nativeObject
oG2antt.BeginUpdate()
oG2antt.Template = [HTMLPicture("expand") = "gCJKBOI4NBQaBQAhQNJJIIhShQACERCAIA0RD7zf5hiIBOZSI5CACuZwcdMRAhnIJNIMKWKPBb8MIFiIJOBILJzhQOYM7YIBXCRNbtiIYOhFLB0KZvMx0O5hORlABQMJpNx0FxOIpUEA1FwxFw3RbWe45iK2MpYJJmJJJFQABERmgaAM0AMRJURDd1AF3hUQhQoAIDvsRAURGIBw8ThRaiJpQ4EwsKNURyzZO13dGEAGYzWcqlWrFarlesA3AGcSAHAGShQwGQzGABUGEv2TAAFUGS26Uy2GwuH1wAKQ5HAAw+s4YwGIwGGWNa6awbST7DBTiLyJJEIJUHBPUqSGJuYYwCAES5pBiQfyEX4QKAFH6QSihJQ/GZlET1FhIcgGnUdoVHMmxajSIghlMKhsGiAAFggQ5dmKcRHEUEhbFAFQBgacABmAAJgAAcAJkAZgNjUcwDFecYcD8QoIDsGJjD6aYaGyHI7mqLRfgGfBcg+TYggkEhakQThtFsEpAE2Xh7goSIJiSHp6haKgPGOXx3j+c5hiKLpri6JAPHWYJREuFJkBCYxcFeYS7ikJQzG0ZIVGKMBYGsVwXDWVQHjqfpjAoYpyE4Z5vH2YoHDkZwzkkUxHC8pwCgifIHBCdk4GMLQVmcXJVhicxWi4IIUiKSQ1A8cBUj+eBEGCFQlFSIophiPRkFAWBLFALhwm+HhKjARpmgSGwNn4AIUCcZZUFEKoVmwywkiKJwiFcIQwEEgI"] // oG2antt.HTMLPicture("expand") = "gCJKBOI4NBQaBQAhQNJJIIhShQACERCAIA0RD7zf5hiIBOZSI5CACuZwcdMRAhnIJNIMKWKPBb8MIFiIJOBILJzhQOYM7YIBXCRNbtiIYOhFLB0KZvMx0O5hORlABQMJpNx0FxOIpUEA1FwxFw3RbWe45iK2MpYJJmJJJFQABERmgaAM0AMRJURDd1AF3hUQhQoAIDvsRAURGIBw8ThRaiJpQ4EwsKNURyzZO13dGEAGYzWcqlWrFarlesA3AGcSAHAGShQwGQzGABUGEv2TAAFUGS26Uy2GwuH1wAKQ5HAAw+s4YwGIwGGWNa6awbST7DBTiLyJJEIJUHBPUqSGJuYYwCAES5pBiQfyEX4QKAFH6QSihJQ/GZlET1FhIcgGnUdoVHMmxajSIghlMKhsGiAAFggQ5dmKcRHEUEhbFAFQBgacABmAAJgAAcAJkAZgNjUcwDFecYcD8QoIDsGJjD6aYaGyHI7mqLRfgGfBcg+TYggkEhakQThtFsEpAE2Xh7goSIJiSHp6haKgPGOXx3j+c5hiKLpri6JAPHWYJREuFJkBCYxcFeYS7ikJQzG0ZIVGKMBYGsVwXDWVQHjqfpjAoYpyE4Z5vH2YoHDkZwzkkUxHC8pwCgifIHBCdk4GMLQVmcXJVhicxWi4IIUiKSQ1A8cBUj+eBEGCFQlFSIophiPRkFAWBLFALhwm+HhKjARpmgSGwNn4AIUCcZZUFEKoVmwywkiKJwiFcIQwEEgI"
oG2antt.Template = [HTMLPicture("collapse") = "gCJKBOI4NBQaBQAhQNJJIIhShQACERCAIA0RD7zf5hiIBOZSI5CACuZwcdMRAhnIJNIMKWKPBb8MIFiIJOBILJzhQOYM7YIBXCRNbtiIYOhFLB0KZvMx0O5hORlABQMJpNx0FxOIpUEA1FwxFw3RbWe45iK2MpYJJmJJJFQABERmgaAM0AMRJURDd1AF3hUQhQoAIDvsRAURGIBw8ThRaiJpQ4EwsKNURyzZO13dGEAGYzWcqlWrFarlesA3AGcSAHAGShQwGQzGABUGEv2TAAFUGS26Uy2GwuH1wAKQ5HAAw+s4YwGIwGGWNa6awbST7DBTiLZJJEIJUHBPdpSGKOAQxCAzGhIBKfbAvUBsSIPbiVMhLTxJPK3banJB0N5sA8VQRlmCRKjSCRaAIOgCiORISiWaI0DYLJPBYJBxB+LAqAMBRgAsIABjAAhYAOEB5kKDQ5kGZoaCaL5vH2KoEDCbpbDaWRrE8SopE+AA/DcMoZkgAgkhKERDlcdYEHAJRzg4IpyCAKRyl6HZLGONwMEMb5clwWB3n2CZki6FoWC4cwQCbGYukKwhiAwOp3HIEJFGCNBGDyLArE8R56n4RUnlOShHGcXJdgcKQlCOSRdEcLw8DmAoInyexvFeMRGG0DARmsbRZmsfRxleFZeHoD4eEKKRxGmPANgAC5xDAWpYHMW4uCGywkiKJwiFcIQwEEgI"] // oG2antt.HTMLPicture("collapse") = "gCJKBOI4NBQaBQAhQNJJIIhShQACERCAIA0RD7zf5hiIBOZSI5CACuZwcdMRAhnIJNIMKWKPBb8MIFiIJOBILJzhQOYM7YIBXCRNbtiIYOhFLB0KZvMx0O5hORlABQMJpNx0FxOIpUEA1FwxFw3RbWe45iK2MpYJJmJJJFQABERmgaAM0AMRJURDd1AF3hUQhQoAIDvsRAURGIBw8ThRaiJpQ4EwsKNURyzZO13dGEAGYzWcqlWrFarlesA3AGcSAHAGShQwGQzGABUGEv2TAAFUGS26Uy2GwuH1wAKQ5HAAw+s4YwGIwGGWNa6awbST7DBTiLZJJEIJUHBPdpSGKOAQxCAzGhIBKfbAvUBsSIPbiVMhLTxJPK3banJB0N5sA8VQRlmCRKjSCRaAIOgCiORISiWaI0DYLJPBYJBxB+LAqAMBRgAsIABjAAhYAOEB5kKDQ5kGZoaCaL5vH2KoEDCbpbDaWRrE8SopE+AA/DcMoZkgAgkhKERDlcdYEHAJRzg4IpyCAKRyl6HZLGONwMEMb5clwWB3n2CZki6FoWC4cwQCbGYukKwhiAwOp3HIEJFGCNBGDyLArE8R56n4RUnlOShHGcXJdgcKQlCOSRdEcLw8DmAoInyexvFeMRGG0DARmsbRZmsfRxleFZeHoD4eEKKRxGmPANgAC5xDAWpYHMW4uCGywkiKJwiFcIQwEEgI"
oG2antt.HeaderVisible = false
oG2antt.HasLines = 0
oG2antt.HasButtons = 0
oG2antt.Indent = 12
oG2antt.DefaultItemHeight = 24
oG2antt.DrawGridLines = 1
oG2antt.GridLineStyle = 48
oG2antt.GridLineColor = 0xcccccc
oG2antt.ShowFocusRect = false
oG2antt.ExpandOnDblClick = false
oG2antt.ExpandOnKeys = false
var_Columns = oG2antt.Columns
	var_Column = var_Columns.Add("Item")
		// var_Column.Def(17) = 1
		with (oG2antt)
			TemplateDef = [dim var_Column]
			TemplateDef = var_Column
			Template = [var_Column.Def(17) = 1]
		endwith
		var_Column.FormatColumn = "(len(parent(1 index ``)) ? (`<b><fgcolor gray>` + (1 pos ``) + `. ` + `</fgcolor></b>` + `<a ` + (0 index ``) + `><img>` + (%CC0 ? (not %CX0 ? `expand` : `collapse`) : `collapse`) + `:16</img></a>`) : ``) + ` ` + value"
		var_Editor = var_Column.Editor
			var_Editor.EditType = 1
			// var_Editor.Option(116) = "32D 4D -4D -4D"
			with (oG2antt)
				TemplateDef = [dim var_Editor]
				TemplateDef = var_Editor
				Template = [var_Editor.Option(116) = "32D 4D -4D -4D"]
			endwith
var_Items = oG2antt.Items
	hRoot = var_Items.AddItem("ACME Corporation")
	// var_Items.SelectableItem(hRoot) = false
	with (oG2antt)
		TemplateDef = [dim var_Items,hRoot]
		TemplateDef = var_Items
		TemplateDef = hRoot
		Template = [var_Items.SelectableItem(hRoot) = False]
	endwith
	// var_Items.ExpandItem(hRoot) = true
	with (oG2antt)
		TemplateDef = [dim var_Items,hRoot]
		TemplateDef = var_Items
		TemplateDef = hRoot
		Template = [var_Items.ExpandItem(hRoot) = True]
	endwith
	h = var_Items.InsertItem(hRoot,null,"Management")
	var_Items.InsertItem(h,null,"CEO - Alice Brown")
	var_Items.InsertItem(h,null,"COO - James Lee")
	h = var_Items.InsertItem(hRoot,null,"HR Department")
	var_Items.InsertItem(h,null,"Recruiter - Jane Smith")
	var_Items.InsertItem(h,null,"HR Assistant - Bob Green")
	// var_Items.ExpandItem(h) = true
	with (oG2antt)
		TemplateDef = [dim var_Items,h]
		TemplateDef = var_Items
		TemplateDef = h
		Template = [var_Items.ExpandItem(h) = True]
	endwith
	h = var_Items.InsertItem(h,null,"Engineering")
	var_Items.InsertItem(h,null,"Software Team")
	h = var_Items.InsertItem(h,null,"Lead Developer - Mark H.")
	var_Items.InsertItem(h,null,"Frontend Dev - Emily R.")
	var_Items.InsertItem(h,null,"Backend Dev - Tom W.")
	var_Items.InsertItem(hRoot,null,"QA Team")
oG2antt.EndUpdate()
|
|
2392
|
How can I update the bar's start position without affecting its working duration
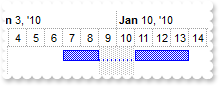
local h,oG2antt,var_Bar,var_Chart,var_Items

oG2antt = form.EXG2ANTTCHARTACTIVEXCONTROL1.nativeObject
oG2antt.BeginUpdate()
var_Chart = oG2antt.Chart
	var_Chart.FirstVisibleDate = "12/31/2009"
	var_Chart.LevelCount = 2
	// var_Chart.PaneWidth(false) = 96
	with (oG2antt)
		TemplateDef = [dim var_Chart]
		TemplateDef = var_Chart
		Template = [var_Chart.PaneWidth(False) = 96]
	endwith
	var_Bar = var_Chart.Bars.Add("Task:Split")
		// var_Bar.Def(20) = true
		with (oG2antt)
			TemplateDef = [dim var_Bar]
			TemplateDef = var_Bar
			Template = [var_Bar.Def(20) = True]
		endwith
		var_Bar.Shortcut = "Task"
oG2antt.Columns.Add("")
var_Items = oG2antt.Items
	h = var_Items.AddItem("Item")
	var_Items.AddBar(h,"Task","01/04/2010","01/09/2010","")
	// var_Items.ItemBar(h,"",544) = "01/07/2010"
	with (oG2antt)
		TemplateDef = [dim var_Items,h]
		TemplateDef = var_Items
		TemplateDef = h
		Template = [var_Items.ItemBar(h,"",544) = #1/7/2010#]
	endwith
oG2antt.EndUpdate()
|
|
2391
|
How can I update the bar's start position without affecting its duration
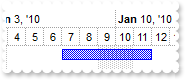
local h,oG2antt,var_Chart,var_Items

oG2antt = form.EXG2ANTTCHARTACTIVEXCONTROL1.nativeObject
oG2antt.BeginUpdate()
var_Chart = oG2antt.Chart
	var_Chart.FirstVisibleDate = "12/31/2009"
	var_Chart.LevelCount = 2
	// var_Chart.PaneWidth(false) = 96
	with (oG2antt)
		TemplateDef = [dim var_Chart]
		TemplateDef = var_Chart
		Template = [var_Chart.PaneWidth(False) = 96]
	endwith
oG2antt.Columns.Add("")
var_Items = oG2antt.Items
	h = var_Items.AddItem("Item")
	var_Items.AddBar(h,"Task","01/04/2010","01/09/2010","")
	// var_Items.ItemBar(h,"",544) = "01/07/2010"
	with (oG2antt)
		TemplateDef = [dim var_Items,h]
		TemplateDef = var_Items
		TemplateDef = h
		Template = [var_Items.ItemBar(h,"",544) = #1/7/2010#]
	endwith
oG2antt.EndUpdate()
|
|
2390
|
Change the tooltip position for the chart
/*
with (this.EXG2ANTTCHARTACTIVEXCONTROL1.nativeObject)
	ToolTip = class::nativeObject_ToolTip
endwith
*/
// Fired when the control prepares the object's tooltip.
function nativeObject_ToolTip(Item, ColIndex, Visible, X, Y, CX, CY)
	oG2antt = form.EXG2ANTTCHARTACTIVEXCONTROL1.nativeObject
	Y = oG2antt.FormatABC("A = -6 ? B + 60 : B",ColIndex,Y)
return

local oG2antt,var_Chart,var_Items

oG2antt = form.EXG2ANTTCHARTACTIVEXCONTROL1.nativeObject
oG2antt.BeginUpdate()
var_Chart = oG2antt.Chart
	var_Chart.ToolTip = "This is a bit of text that's shown while hovers the level"
	var_Chart.FirstVisibleDate = "12/31/2009"
	var_Chart.LevelCount = 2
	// var_Chart.PaneWidth(false) = 96
	with (oG2antt)
		TemplateDef = [dim var_Chart]
		TemplateDef = var_Chart
		Template = [var_Chart.PaneWidth(False) = 96]
	endwith
oG2antt.Columns.Add("Type")
var_Items = oG2antt.Items
	var_Items.AddBar(var_Items.AddItem("Item 1"),"Task","01/04/2010","01/09/2010")
oG2antt.EndUpdate()
|
|
2389
|
Change the tooltip position for the overview
/*
with (this.EXG2ANTTCHARTACTIVEXCONTROL1.nativeObject)
	ToolTip = class::nativeObject_ToolTip
endwith
*/
// Fired when the control prepares the object's tooltip.
function nativeObject_ToolTip(Item, ColIndex, Visible, X, Y, CX, CY)
	oG2antt = form.EXG2ANTTCHARTACTIVEXCONTROL1.nativeObject
	X = oG2antt.FormatABC("A = -5 ? B - C/2 : B",ColIndex,X,CX)
return

local oG2antt,var_Chart,var_Items

oG2antt = form.EXG2ANTTCHARTACTIVEXCONTROL1.nativeObject
oG2antt.BeginUpdate()
var_Chart = oG2antt.Chart
	var_Chart.OverviewVisible = -1
	var_Chart.OverviewToolTip = "This is a bit of text that's shown while hovers the level"
	var_Chart.FirstVisibleDate = "12/31/2009"
	var_Chart.LevelCount = 2
	// var_Chart.PaneWidth(false) = 96
	with (oG2antt)
		TemplateDef = [dim var_Chart]
		TemplateDef = var_Chart
		Template = [var_Chart.PaneWidth(False) = 96]
	endwith
oG2antt.Columns.Add("Type")
var_Items = oG2antt.Items
	var_Items.AddBar(var_Items.AddItem("Item 1"),"Task","01/04/2010","01/09/2010")
oG2antt.EndUpdate()
|
|
2388
|
Change the tooltip position for the note
/*
with (this.EXG2ANTTCHARTACTIVEXCONTROL1.nativeObject)
	ToolTip = class::nativeObject_ToolTip
endwith
*/
// Fired when the control prepares the object's tooltip.
function nativeObject_ToolTip(Item, ColIndex, Visible, X, Y, CX, CY)
	oG2antt = form.EXG2ANTTCHARTACTIVEXCONTROL1.nativeObject
	Y = oG2antt.FormatABC("A = -4 ? B - 6 : B",ColIndex,Y)
return

local oG2antt,var_Chart,var_Items,var_Note,var_Notes

oG2antt = form.EXG2ANTTCHARTACTIVEXCONTROL1.nativeObject
oG2antt.BeginUpdate()
var_Chart = oG2antt.Chart
	var_Chart.FirstVisibleDate = "12/31/2009"
	var_Chart.LevelCount = 2
	// var_Chart.PaneWidth(false) = 96
	with (oG2antt)
		TemplateDef = [dim var_Chart]
		TemplateDef = var_Chart
		Template = [var_Chart.PaneWidth(False) = 96]
	endwith
oG2antt.Columns.Add("Type")
var_Items = oG2antt.Items
	var_Items.AddBar(var_Items.AddItem("Item 1"),"Task","01/04/2010","01/09/2010")
var_Notes = oG2antt.Chart.Notes
	// var_Notes.Add("1S",oG2antt.Items.FirstVisibleItem,"","Note").PartToolTip(1) = "This is a bit of text that's shown while hovers the level"
	var_Note = var_Notes.Add("1S",oG2antt.Items.FirstVisibleItem,"","Note")
	with (oG2antt)
		TemplateDef = [dim var_Note]
		TemplateDef = var_Note
		Template = [var_Note.PartToolTip(1) = "This is a bit of text that's shown while hovers the level"]
	endwith
oG2antt.EndUpdate()
|
|
2387
|
Change the tooltip position for the link
/*
with (this.EXG2ANTTCHARTACTIVEXCONTROL1.nativeObject)
	ToolTip = class::nativeObject_ToolTip
endwith
*/
// Fired when the control prepares the object's tooltip.
function nativeObject_ToolTip(Item, ColIndex, Visible, X, Y, CX, CY)
	oG2antt = form.EXG2ANTTCHARTACTIVEXCONTROL1.nativeObject
	X = oG2antt.FormatABC("A = -3 ? B - 16 : B",ColIndex,X)
return

local oG2antt,var_Chart,var_Items

oG2antt = form.EXG2ANTTCHARTACTIVEXCONTROL1.nativeObject
oG2antt.BeginUpdate()
var_Chart = oG2antt.Chart
	var_Chart.FirstVisibleDate = "12/31/2009"
	var_Chart.LevelCount = 2
	// var_Chart.PaneWidth(false) = 96
	with (oG2antt)
		TemplateDef = [dim var_Chart]
		TemplateDef = var_Chart
		Template = [var_Chart.PaneWidth(False) = 96]
	endwith
oG2antt.Columns.Add("Type")
var_Items = oG2antt.Items
	var_Items.AddBar(var_Items.AddItem("Item 1"),"Task","01/04/2010","01/09/2010")
	var_Items.AddBar(var_Items.AddItem("Item 1"),"Task","01/04/2010","01/09/2010")
	var_Items.AddLink("link",var_Items.ItemByIndex(0),"",var_Items.ItemByIndex(1),"")
	// var_Items.Link("link",13) = "This is a bit of text that's shown while hovers the level"
	with (oG2antt)
		TemplateDef = [dim var_Items]
		TemplateDef = var_Items
		Template = [var_Items.Link("link",13) = "This is a bit of text that's shown while hovers the level"]
	endwith
oG2antt.EndUpdate()
|
|
2386
|
Change the tooltip position for the bar
/*
with (this.EXG2ANTTCHARTACTIVEXCONTROL1.nativeObject)
	ToolTip = class::nativeObject_ToolTip
endwith
*/
// Fired when the control prepares the object's tooltip.
function nativeObject_ToolTip(Item, ColIndex, Visible, X, Y, CX, CY)
	oG2antt = form.EXG2ANTTCHARTACTIVEXCONTROL1.nativeObject
	X = oG2antt.FormatABC("A = -2 ? B + 16 : B",ColIndex,X)
return

local oG2antt,var_Bars,var_Chart,var_Items

oG2antt = form.EXG2ANTTCHARTACTIVEXCONTROL1.nativeObject
oG2antt.BeginUpdate()
var_Chart = oG2antt.Chart
	var_Chart.FirstVisibleDate = "12/31/2009"
	var_Chart.LevelCount = 2
	// var_Chart.PaneWidth(false) = 96
	with (oG2antt)
		TemplateDef = [dim var_Chart]
		TemplateDef = var_Chart
		Template = [var_Chart.PaneWidth(False) = 96]
	endwith
	// var_Chart.Bars.Item("Task").Def(6) = "This is a bit of text that's shown while hovers the level"
	var_Bars = var_Chart.Bars.Item("Task")
	with (oG2antt)
		TemplateDef = [dim var_Bars]
		TemplateDef = var_Bars
		Template = [var_Bars.Def(6) = "This is a bit of text that's shown while hovers the level"]
	endwith
oG2antt.Columns.Add("Type")
var_Items = oG2antt.Items
	var_Items.AddBar(var_Items.AddItem("Original"),"Task","01/04/2010","01/09/2010","")
oG2antt.EndUpdate()
|
|
2385
|
Change the tooltip position for the chart's level/header
/*
with (this.EXG2ANTTCHARTACTIVEXCONTROL1.nativeObject)
	ToolTip = class::nativeObject_ToolTip
endwith
*/
// Fired when the control prepares the object's tooltip.
function nativeObject_ToolTip(Item, ColIndex, Visible, X, Y, CX, CY)
	oG2antt = form.EXG2ANTTCHARTACTIVEXCONTROL1.nativeObject
	Y = oG2antt.FormatABC("A = -1 ? B + 16 : B",ColIndex,Y)
return

local oG2antt,var_Chart,var_Items,var_Level

oG2antt = form.EXG2ANTTCHARTACTIVEXCONTROL1.nativeObject
oG2antt.BeginUpdate()
var_Chart = oG2antt.Chart
	var_Chart.FirstVisibleDate = "12/31/2009"
	var_Chart.LevelCount = 2
	// var_Chart.PaneWidth(false) = 96
	with (oG2antt)
		TemplateDef = [dim var_Chart]
		TemplateDef = var_Chart
		Template = [var_Chart.PaneWidth(False) = 96]
	endwith
	// var_Chart.Level(0).ToolTip = "This is a bit of text that's shown while hovers the level"
	var_Level = var_Chart.Level(0)
	with (oG2antt)
		TemplateDef = [dim var_Level]
		TemplateDef = var_Level
		Template = [var_Level.ToolTip = "This is a bit of text that's shown while hovers the level"]
	endwith
oG2antt.Columns.Add("Type")
var_Items = oG2antt.Items
	var_Items.AddBar(var_Items.AddItem("Original"),"Task","01/04/2010","01/09/2010","")
oG2antt.EndUpdate()
|
|
2384
|
Change the tooltip position for the column
/*
with (this.EXG2ANTTCHARTACTIVEXCONTROL1.nativeObject)
	ToolTip = class::nativeObject_ToolTip
endwith
*/
// Fired when the control prepares the object's tooltip.
function nativeObject_ToolTip(Item, ColIndex, Visible, X, Y, CX, CY)
	oG2antt = form.EXG2ANTTCHARTACTIVEXCONTROL1.nativeObject
	X = oG2antt.FormatABC("A >= 0 ? B - 64 : B",ColIndex,X)
	Y = oG2antt.FormatABC("A >= 0 ? B + 24 : B",ColIndex,Y)
return

local oG2antt,var_Chart,var_Column,var_Items

oG2antt = form.EXG2ANTTCHARTACTIVEXCONTROL1.nativeObject
oG2antt.BeginUpdate()
var_Chart = oG2antt.Chart
	var_Chart.FirstVisibleDate = "12/31/2009"
	var_Chart.LevelCount = 2
	// var_Chart.PaneWidth(false) = 96
	with (oG2antt)
		TemplateDef = [dim var_Chart]
		TemplateDef = var_Chart
		Template = [var_Chart.PaneWidth(False) = 96]
	endwith
// oG2antt.Columns.Add("Type").ToolTip = "This is a bit of text that's shown while hovers the column"
var_Column = oG2antt.Columns.Add("Type")
with (oG2antt)
	TemplateDef = [dim var_Column]
	TemplateDef = var_Column
	Template = [var_Column.ToolTip = "This is a bit of text that's shown while hovers the column"]
endwith
var_Items = oG2antt.Items
	var_Items.AddBar(var_Items.AddItem("Original"),"Task","01/04/2010","01/09/2010","")
oG2antt.EndUpdate()
|
|
2383
|
Change the properties of bars within the specified date range
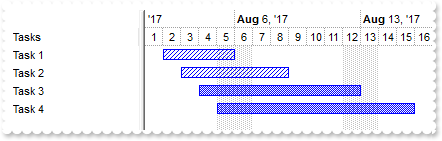
local oG2antt,var_Chart,var_Items

oG2antt = form.EXG2ANTTCHARTACTIVEXCONTROL1.nativeObject
oG2antt.BeginUpdate()
oG2antt.Columns.Add("Tasks")
var_Chart = oG2antt.Chart
	var_Chart.FirstVisibleDate = "08/01/2017"
	var_Chart.LevelCount = 2
	// var_Chart.PaneWidth(false) = 128
	with (oG2antt)
		TemplateDef = [dim var_Chart]
		TemplateDef = var_Chart
		Template = [var_Chart.PaneWidth(False) = 128]
	endwith
var_Items = oG2antt.Items
	var_Items.AddBar(var_Items.AddItem("Task 1"),"Task","08/02/2017","08/06/2017")
	var_Items.AddBar(var_Items.AddItem("Task 2"),"Task","08/03/2017","08/09/2017")
	var_Items.AddBar(var_Items.AddItem("Task 3"),"Task","08/04/2017","08/13/2017")
	var_Items.AddBar(var_Items.AddItem("Task 4"),"Task","08/05/2017","08/16/2017")
	// var_Items.ItemBarEx("(itembar(2) <= #8/9/2017#) and (itembar(1) >= #8/1/2017#)",42) = 6
	with (oG2antt)
		TemplateDef = [dim var_Items]
		TemplateDef = var_Items
		Template = [var_Items.ItemBarEx("(itembar(2) <= #8/9/2017#) and (itembar(1) >= #8/1/2017#)",42) = 6]
	endwith
oG2antt.EndUpdate()
|
|
2382
|
Set the base level in 3-day intervals
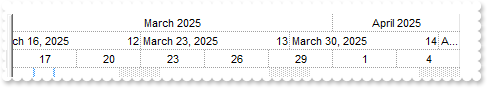
local oG2antt,var_Chart,var_Level,var_Level1,var_Level2

oG2antt = form.EXG2ANTTCHARTACTIVEXCONTROL1.nativeObject
oG2antt.BeginUpdate()
var_Chart = oG2antt.Chart
	var_Chart.FirstVisibleDate = "03/17/2025"
	// var_Chart.PaneWidth(false) = 128
	with (oG2antt)
		TemplateDef = [dim var_Chart]
		TemplateDef = var_Chart
		Template = [var_Chart.PaneWidth(False) = 128]
	endwith
	var_Chart.LevelCount = 3
	// var_Chart.Level(2).Count = 3
	var_Level = var_Chart.Level(2)
	with (oG2antt)
		TemplateDef = [dim var_Level]
		TemplateDef = var_Level
		Template = [var_Level.Count = 3]
	endwith
	// var_Chart.Level(1).Label = 256
	var_Level1 = var_Chart.Level(1)
	with (oG2antt)
		TemplateDef = [dim var_Level1]
		TemplateDef = var_Level1
		Template = [var_Level1.Label = 256]
	endwith
	var_Level2 = var_Chart.Level(0)
		var_Level2.Label = 16
		var_Level2.Alignment = 17 /*exHOutside | CenterAlignment*/
	var_Chart.UnitWidth = 64
oG2antt.EndUpdate()
|
|
2381
|
I am using EBN for my milestone bars, but they appear very small on high DPI resolutions
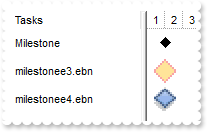
local oG2antt,var_Appearance,var_Bar,var_Bar1,var_Chart,var_Items

oG2antt = form.EXG2ANTTCHARTACTIVEXCONTROL1.nativeObject
oG2antt.BeginUpdate()
var_Appearance = oG2antt.VisualAppearance
	var_Appearance.Add(1,"gBFLBCJwBAEHhEJAAEhABM8GACAADACAxRDAMgBQKAAzQFAYahqGKGAAGOD4JhUAIIRZGMIjFDcEwxC6EX7kIAJCb+IIDATCIyjAIoWhxFKGZYlYAoJDENo0QRCcZTRI8NQGCyEQwnOQZDiWFofR6CEIlAZJRjoOo5DJGGL0WAaAxCEzVMYjNBIUQTICBaCgOCLCgkYJWT5aMi2XZlWzdNhTVIfC4XYq+dp3UZJF4XXZtaTpPjALxwG5rerJGTkP7hb74LauBzdAbHLaxTCsKwzEZtZBjWR4RimOY9RLEMqxbKcDxvIKnZzpehYHomCTlOjUdhzfYtKy+cp7azbejbJrmZ5DWzGbr3HC+Az3KK+cbyOo6XgVYaLZDjOh5DhkgwAY7mgdg5F2Hg2DIB5Xm0eA6F4HJ/HeLZPnGeg8F2TgHHuT5qm2fA8B4W5vjuY5vmSdQkle7p/m+dx+FwN5RHMYYfGeRZ5GYH42joAw+B+ZxmAcWwgBWYZ9gOHAGEYERdmEN5KBUaJghYXZEgKXI4G4Hh1GINIVl+A5akgdglgmIgoi0a4FmIOIiCMQJOjQRQJEAQCAgA==")
	var_Appearance.Add(2,"CP:1 0 -1D 11D 1D")
	var_Appearance.Add(3,"gBFLBCJwBAEHhEJAAEhABIICg6AADACAxRDAMgBQKAAzQFAYahqGKGAAGOD4JhUAIIRZGMIjFDcEwxC6EX7kIAJCb+IIDATCIyjAIoWhxFKGZYlYAoJDENo0QRCcZTRI8NQGCyEQ4nOQZDiWFofR6CEIlAZJRjoOo5DJGGL1GAeAxCEzVMYjNBIUQTICBaCgOCAYhYcJWT5aMi2XZlWzaaBnWauC4rRrObp3XhbMB3TbkSznP66bhvXA7MrvBJ+YDdGJLMwTC4YYrAGawe6MGxPEaRY7jeQ5Ha+KzxS7EWDXBTdCS1DBeD7pY76LouN45Ty7dAxLTNDyrKq0KzrWR7A7+ZTnXBFTDJXgSNThGx+cYfXCcJrGdYpEi2N6uHgHAuCZJmScp4FyXBNnYB5SGcdSTiaGoMm+ZA7jsFpph8Shnk+Z5shMex4iuUADj+YZiHuPI+k8Z5km+cB8hcZgVlAWpfHeDZlHmX43ioCR6mCJ4pn0fANFMEI3gQSx3lEbYBESV52AuBpgleNgHHkYQIEoFB9CESBRnCBohlgcgMgqYooD2VRwiIWBJAODBLHiHgfHoIoYmYLIOh+SJeCGBJjCAAY2GoHR3B4KoRmOSQmCuERHmkDA/ECZJpDISIOmUSROAuEwkmiTgigSHwCkiIgjiWYg6FaEogjMUIyCaZhiG4P4FCWKQCDWC5ElmBhhhiZRYmoaYaGaOQFG2DQfAmXhnDsTAyiqhwoBoDoGiAZ5piocINCEZYyHyHAohoH" ;
	 +"oEiSaQqCYeYFGAJZ2g8eIEloJJ3DKSxqHyNoliiORuhgXhbkmbomh8Zh5iaIooioShygwXwqhWcobHWHB3GKJYbhmRIaAMYZrHcChMiWa5alWE4NCSapOj0WpsGsAomjIahrC6GY0heAxYlwNwtGMcpUHObY1l6WY2G2VY5AMOpRBQJQBICA=")
	var_Appearance.Add(4,"CP:3 0 -1D 11D 1D")
var_Chart = oG2antt.Chart
	// var_Chart.PaneWidth(false) = 128
	with (oG2antt)
		TemplateDef = [dim var_Chart]
		TemplateDef = var_Chart
		Template = [var_Chart.PaneWidth(False) = 128]
	endwith
	var_Chart.FirstVisibleDate = "01/01/2001"
	var_Bar = var_Chart.Bars.Copy("Milestone","Milestonee3")
		var_Bar.Color = 0x2000000
		var_Bar.Height = 22
	var_Bar1 = var_Chart.Bars.Copy("Milestone","Milestonee4")
		var_Bar1.Color = 0x4000000
		var_Bar1.Height = 22
oG2antt.DefaultItemHeight = 28
oG2antt.Columns.Add("Tasks")
var_Items = oG2antt.Items
	var_Items.AddBar(var_Items.AddItem("Milestone"),"Milestone","01/02/2001","01/02/2001")
	var_Items.AddBar(var_Items.AddItem("milestonee3.ebn"),"Milestonee3","01/02/2001","01/02/2001")
	var_Items.AddBar(var_Items.AddItem("milestonee4.ebn"),"Milestonee4","01/02/2001","01/02/2001")
oG2antt.EndUpdate()
|
|
2380
|
How can I vertically scroll the control
/*
with (this.EXG2ANTTCHARTACTIVEXCONTROL1.nativeObject)
	AddItem = class::nativeObject_AddItem
endwith
*/
// Occurs after a new Item has been inserted to Items collection.
function nativeObject_AddItem(Item)
	local var_Items
	oG2antt = form.EXG2ANTTCHARTACTIVEXCONTROL1.nativeObject
	var_Items = oG2antt.Items
		var_Items.AddBar(Item,"Task",var_Items.CellValue(Item,2),var_Items.CellValue(Item,4))
return

local oG2antt,var_Chart,var_Columns,var_Columns1

oG2antt = form.EXG2ANTTCHARTACTIVEXCONTROL1.nativeObject
oG2antt.BeginUpdate()
oG2antt.ColumnAutoResize = false
oG2antt.DataSource = new OleAutoClient("DAO.DBEngine.120").OpenDatabase("C:\Program Files\Exontrol\ExG2antt\Sample\Access\misc.accdb").OpenRecordset("Orders")
var_Chart = oG2antt.Chart
	var_Chart.FirstVisibleDate = "08/04/1994"
	var_Chart.LevelCount = 2
	// var_Chart.PaneWidth(false) = 256
	with (oG2antt)
		TemplateDef = [dim var_Chart]
		TemplateDef = var_Chart
		Template = [var_Chart.PaneWidth(False) = 256]
	endwith
oG2antt.Items.AllowCellValueToItemBar = true
// oG2antt.Columns.Item(2).Def(18) = 1
var_Columns = oG2antt.Columns.Item(2)
with (oG2antt)
	TemplateDef = [dim var_Columns]
	TemplateDef = var_Columns
	Template = [var_Columns.Def(18) = 1]
endwith
// oG2antt.Columns.Item(4).Def(18) = 2
var_Columns1 = oG2antt.Columns.Item(4)
with (oG2antt)
	TemplateDef = [dim var_Columns1]
	TemplateDef = var_Columns1
	Template = [var_Columns1.Def(18) = 2]
endwith
oG2antt.Layout = "Collapse=" + ["] + "" + ["] + ";VScroll=10"
oG2antt.EndUpdate()
|
|
2379
|
Export the items as a two-dimensional array
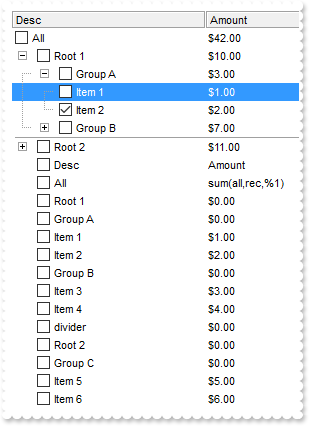
local g1,g2,h,oG2antt,r,var_Column,var_Column1,var_Columns,var_Items

oG2antt = form.EXG2ANTTCHARTACTIVEXCONTROL1.nativeObject
oG2antt.BeginUpdate()
oG2antt.HeaderAppearance = 4
oG2antt.ScrollBySingleLine = true
oG2antt.LinesAtRoot = 5
var_Columns = oG2antt.Columns
	var_Column = var_Columns.Add("Desc")
		var_Column.Width = 32
		// var_Column.Def(0) = true
		with (oG2antt)
			TemplateDef = [dim var_Column]
			TemplateDef = var_Column
			Template = [var_Column.Def(0) = True]
		endwith
	var_Column1 = var_Columns.Add("Amount")
		// var_Column1.Def(20) = "sum(current,rec,%1)"
		with (oG2antt)
			TemplateDef = [dim var_Column1]
			TemplateDef = var_Column1
			Template = [var_Column1.Def(20) = "sum(current,rec,%1)"]
		endwith
		var_Column1.FormatColumn = "currency(value)"
var_Items = oG2antt.Items
	// var_Items.LockedItemCount(0) = 1
	with (oG2antt)
		TemplateDef = [dim var_Items]
		TemplateDef = var_Items
		Template = [var_Items.LockedItemCount(0) = 1]
	endwith
	h = var_Items.LockedItem(0,0)
	// var_Items.CellValue(h,0) = "All"
	with (oG2antt)
		TemplateDef = [dim var_Items,h]
		TemplateDef = var_Items
		TemplateDef = h
		Template = [var_Items.CellValue(h,0) = "All"]
	endwith
	// var_Items.CellValue(h,1) = "sum(all,rec,%1)"
	with (oG2antt)
		TemplateDef = [dim var_Items,h]
		TemplateDef = var_Items
		TemplateDef = h
		Template = [var_Items.CellValue(h,1) = "sum(all,rec,%1)"]
	endwith
	// var_Items.CellValueFormat(h,1) = 4
	with (oG2antt)
		TemplateDef = [dim var_Items,h]
		TemplateDef = var_Items
		TemplateDef = h
		Template = [var_Items.CellValueFormat(h,1) = 4]
	endwith
	r = var_Items.AddItem("Root 1")
	g1 = var_Items.InsertItem(r,null,"Group A")
	// var_Items.CellValue(var_Items.InsertItem(g1,null,"Item 1"),1) = 1
	with (oG2antt)
		TemplateDef = [dim var_Items]
		TemplateDef = var_Items
		Template = [var_Items.CellValue(InsertItem(g1,,"Item 1"),1) = 1]
	endwith
	// var_Items.CellValue(var_Items.InsertItem(g1,null,"Item 2"),1) = 2
	with (oG2antt)
		TemplateDef = [dim var_Items]
		TemplateDef = var_Items
		Template = [var_Items.CellValue(InsertItem(g1,,"Item 2"),1) = 2]
	endwith
	// var_Items.CellState(var_Items.ItemByIndex(3),0) = 1
	with (oG2antt)
		TemplateDef = [dim var_Items]
		TemplateDef = var_Items
		Template = [var_Items.CellState(ItemByIndex(3),0) = 1]
	endwith
	g2 = var_Items.InsertItem(r,null,"Group B")
	// var_Items.CellValue(var_Items.InsertItem(g2,null,"Item 3"),1) = 3
	with (oG2antt)
		TemplateDef = [dim var_Items]
		TemplateDef = var_Items
		Template = [var_Items.CellValue(InsertItem(g2,,"Item 3"),1) = 3]
	endwith
	// var_Items.CellValue(var_Items.InsertItem(g2,null,"Item 4"),1) = 4
	with (oG2antt)
		TemplateDef = [dim var_Items]
		TemplateDef = var_Items
		Template = [var_Items.CellValue(InsertItem(g2,,"Item 4"),1) = 4]
	endwith
	// var_Items.ExpandItem(g1) = true
	with (oG2antt)
		TemplateDef = [dim var_Items,g1]
		TemplateDef = var_Items
		TemplateDef = g1
		Template = [var_Items.ExpandItem(g1) = True]
	endwith
	// var_Items.ExpandItem(r) = true
	with (oG2antt)
		TemplateDef = [dim var_Items,r]
		TemplateDef = var_Items
		TemplateDef = r
		Template = [var_Items.ExpandItem(r) = True]
	endwith
	h = var_Items.AddItem("divider")
	// var_Items.ItemDivider(h) = 0
	with (oG2antt)
		TemplateDef = [dim var_Items,h]
		TemplateDef = var_Items
		TemplateDef = h
		Template = [var_Items.ItemDivider(h) = 0]
	endwith
	// var_Items.SelectableItem(h) = false
	with (oG2antt)
		TemplateDef = [dim var_Items,h]
		TemplateDef = var_Items
		TemplateDef = h
		Template = [var_Items.SelectableItem(h) = False]
	endwith
	// var_Items.SortableItem(h) = false
	with (oG2antt)
		TemplateDef = [dim var_Items,h]
		TemplateDef = var_Items
		TemplateDef = h
		Template = [var_Items.SortableItem(h) = False]
	endwith
	// var_Items.ItemHeight(h) = 1
	with (oG2antt)
		TemplateDef = [dim var_Items,h]
		TemplateDef = var_Items
		TemplateDef = h
		Template = [var_Items.ItemHeight(h) = 1]
	endwith
	r = var_Items.AddItem("Root 2")
	g1 = var_Items.InsertItem(r,null,"Group C")
	// var_Items.CellValue(var_Items.InsertItem(g1,null,"Item 5"),1) = 5
	with (oG2antt)
		TemplateDef = [dim var_Items]
		TemplateDef = var_Items
		Template = [var_Items.CellValue(InsertItem(g1,,"Item 5"),1) = 5]
	endwith
	// var_Items.CellValue(var_Items.InsertItem(g1,null,"Item 6"),1) = 6
	with (oG2antt)
		TemplateDef = [dim var_Items]
		TemplateDef = var_Items
		Template = [var_Items.CellValue(InsertItem(g1,,"Item 6"),1) = 6]
	endwith
	// var_Items.SelectItem(var_Items.ItemByIndex(2)) = true
	with (oG2antt)
		TemplateDef = [dim var_Items]
		TemplateDef = var_Items
		Template = [var_Items.SelectItem(ItemByIndex(2)) = True]
	endwith
oG2antt.PutItems(oG2antt.Export("array","all"))
oG2antt.EndUpdate()
|
|
2378
|
Export only expanded items
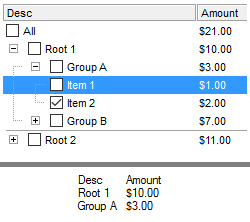
local g1,g2,h,oG2antt,r,var_Column,var_Column1,var_Columns,var_Items

oG2antt = form.EXG2ANTTCHARTACTIVEXCONTROL1.nativeObject
oG2antt.BeginUpdate()
oG2antt.HeaderAppearance = 4
oG2antt.ScrollBySingleLine = true
oG2antt.LinesAtRoot = 5
var_Columns = oG2antt.Columns
	var_Column = var_Columns.Add("Desc")
		var_Column.Width = 32
		// var_Column.Def(0) = true
		with (oG2antt)
			TemplateDef = [dim var_Column]
			TemplateDef = var_Column
			Template = [var_Column.Def(0) = True]
		endwith
	var_Column1 = var_Columns.Add("Amount")
		// var_Column1.Def(20) = "sum(current,rec,%1)"
		with (oG2antt)
			TemplateDef = [dim var_Column1]
			TemplateDef = var_Column1
			Template = [var_Column1.Def(20) = "sum(current,rec,%1)"]
		endwith
		var_Column1.FormatColumn = "currency(value)"
var_Items = oG2antt.Items
	// var_Items.LockedItemCount(0) = 1
	with (oG2antt)
		TemplateDef = [dim var_Items]
		TemplateDef = var_Items
		Template = [var_Items.LockedItemCount(0) = 1]
	endwith
	h = var_Items.LockedItem(0,0)
	// var_Items.CellValue(h,0) = "All"
	with (oG2antt)
		TemplateDef = [dim var_Items,h]
		TemplateDef = var_Items
		TemplateDef = h
		Template = [var_Items.CellValue(h,0) = "All"]
	endwith
	// var_Items.CellValue(h,1) = "sum(all,rec,%1)"
	with (oG2antt)
		TemplateDef = [dim var_Items,h]
		TemplateDef = var_Items
		TemplateDef = h
		Template = [var_Items.CellValue(h,1) = "sum(all,rec,%1)"]
	endwith
	// var_Items.CellValueFormat(h,1) = 4
	with (oG2antt)
		TemplateDef = [dim var_Items,h]
		TemplateDef = var_Items
		TemplateDef = h
		Template = [var_Items.CellValueFormat(h,1) = 4]
	endwith
	r = var_Items.AddItem("Root 1")
	g1 = var_Items.InsertItem(r,null,"Group A")
	// var_Items.CellValue(var_Items.InsertItem(g1,null,"Item 1"),1) = 1
	with (oG2antt)
		TemplateDef = [dim var_Items]
		TemplateDef = var_Items
		Template = [var_Items.CellValue(InsertItem(g1,,"Item 1"),1) = 1]
	endwith
	// var_Items.CellValue(var_Items.InsertItem(g1,null,"Item 2"),1) = 2
	with (oG2antt)
		TemplateDef = [dim var_Items]
		TemplateDef = var_Items
		Template = [var_Items.CellValue(InsertItem(g1,,"Item 2"),1) = 2]
	endwith
	// var_Items.CellState(var_Items.ItemByIndex(3),0) = 1
	with (oG2antt)
		TemplateDef = [dim var_Items]
		TemplateDef = var_Items
		Template = [var_Items.CellState(ItemByIndex(3),0) = 1]
	endwith
	g2 = var_Items.InsertItem(r,null,"Group B")
	// var_Items.CellValue(var_Items.InsertItem(g2,null,"Item 3"),1) = 3
	with (oG2antt)
		TemplateDef = [dim var_Items]
		TemplateDef = var_Items
		Template = [var_Items.CellValue(InsertItem(g2,,"Item 3"),1) = 3]
	endwith
	// var_Items.CellValue(var_Items.InsertItem(g2,null,"Item 4"),1) = 4
	with (oG2antt)
		TemplateDef = [dim var_Items]
		TemplateDef = var_Items
		Template = [var_Items.CellValue(InsertItem(g2,,"Item 4"),1) = 4]
	endwith
	// var_Items.ExpandItem(g1) = true
	with (oG2antt)
		TemplateDef = [dim var_Items,g1]
		TemplateDef = var_Items
		TemplateDef = g1
		Template = [var_Items.ExpandItem(g1) = True]
	endwith
	// var_Items.ExpandItem(r) = true
	with (oG2antt)
		TemplateDef = [dim var_Items,r]
		TemplateDef = var_Items
		TemplateDef = r
		Template = [var_Items.ExpandItem(r) = True]
	endwith
	h = var_Items.AddItem("divider")
	// var_Items.ItemDivider(h) = 0
	with (oG2antt)
		TemplateDef = [dim var_Items,h]
		TemplateDef = var_Items
		TemplateDef = h
		Template = [var_Items.ItemDivider(h) = 0]
	endwith
	// var_Items.SelectableItem(h) = false
	with (oG2antt)
		TemplateDef = [dim var_Items,h]
		TemplateDef = var_Items
		TemplateDef = h
		Template = [var_Items.SelectableItem(h) = False]
	endwith
	// var_Items.SortableItem(h) = false
	with (oG2antt)
		TemplateDef = [dim var_Items,h]
		TemplateDef = var_Items
		TemplateDef = h
		Template = [var_Items.SortableItem(h) = False]
	endwith
	// var_Items.ItemHeight(h) = 1
	with (oG2antt)
		TemplateDef = [dim var_Items,h]
		TemplateDef = var_Items
		TemplateDef = h
		Template = [var_Items.ItemHeight(h) = 1]
	endwith
	r = var_Items.AddItem("Root 2")
	g1 = var_Items.InsertItem(r,null,"Group C")
	// var_Items.CellValue(var_Items.InsertItem(g1,null,"Item 5"),1) = 5
	with (oG2antt)
		TemplateDef = [dim var_Items]
		TemplateDef = var_Items
		Template = [var_Items.CellValue(InsertItem(g1,,"Item 5"),1) = 5]
	endwith
	// var_Items.CellValue(var_Items.InsertItem(g1,null,"Item 6"),1) = 6
	with (oG2antt)
		TemplateDef = [dim var_Items]
		TemplateDef = var_Items
		Template = [var_Items.CellValue(InsertItem(g1,,"Item 6"),1) = 6]
	endwith
	// var_Items.SelectItem(var_Items.ItemByIndex(2)) = true
	with (oG2antt)
		TemplateDef = [dim var_Items]
		TemplateDef = var_Items
		Template = [var_Items.SelectItem(ItemByIndex(2)) = True]
	endwith
oG2antt.EndUpdate()
? Str(oG2antt.Export("","only(expanded)"))
|
|
2377
|
Export only selectable, sortable leaf items that are neither locked nor dividers
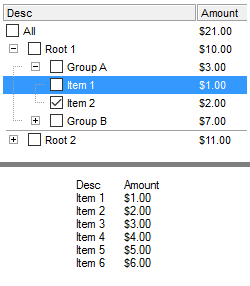
local g1,g2,h,oG2antt,r,var_Column,var_Column1,var_Columns,var_Items

oG2antt = form.EXG2ANTTCHARTACTIVEXCONTROL1.nativeObject
oG2antt.BeginUpdate()
oG2antt.HeaderAppearance = 4
oG2antt.ScrollBySingleLine = true
oG2antt.LinesAtRoot = 5
var_Columns = oG2antt.Columns
	var_Column = var_Columns.Add("Desc")
		var_Column.Width = 32
		// var_Column.Def(0) = true
		with (oG2antt)
			TemplateDef = [dim var_Column]
			TemplateDef = var_Column
			Template = [var_Column.Def(0) = True]
		endwith
	var_Column1 = var_Columns.Add("Amount")
		// var_Column1.Def(20) = "sum(current,rec,%1)"
		with (oG2antt)
			TemplateDef = [dim var_Column1]
			TemplateDef = var_Column1
			Template = [var_Column1.Def(20) = "sum(current,rec,%1)"]
		endwith
		var_Column1.FormatColumn = "currency(value)"
var_Items = oG2antt.Items
	// var_Items.LockedItemCount(0) = 1
	with (oG2antt)
		TemplateDef = [dim var_Items]
		TemplateDef = var_Items
		Template = [var_Items.LockedItemCount(0) = 1]
	endwith
	h = var_Items.LockedItem(0,0)
	// var_Items.CellValue(h,0) = "All"
	with (oG2antt)
		TemplateDef = [dim var_Items,h]
		TemplateDef = var_Items
		TemplateDef = h
		Template = [var_Items.CellValue(h,0) = "All"]
	endwith
	// var_Items.CellValue(h,1) = "sum(all,rec,%1)"
	with (oG2antt)
		TemplateDef = [dim var_Items,h]
		TemplateDef = var_Items
		TemplateDef = h
		Template = [var_Items.CellValue(h,1) = "sum(all,rec,%1)"]
	endwith
	// var_Items.CellValueFormat(h,1) = 4
	with (oG2antt)
		TemplateDef = [dim var_Items,h]
		TemplateDef = var_Items
		TemplateDef = h
		Template = [var_Items.CellValueFormat(h,1) = 4]
	endwith
	r = var_Items.AddItem("Root 1")
	g1 = var_Items.InsertItem(r,null,"Group A")
	// var_Items.CellValue(var_Items.InsertItem(g1,null,"Item 1"),1) = 1
	with (oG2antt)
		TemplateDef = [dim var_Items]
		TemplateDef = var_Items
		Template = [var_Items.CellValue(InsertItem(g1,,"Item 1"),1) = 1]
	endwith
	// var_Items.CellValue(var_Items.InsertItem(g1,null,"Item 2"),1) = 2
	with (oG2antt)
		TemplateDef = [dim var_Items]
		TemplateDef = var_Items
		Template = [var_Items.CellValue(InsertItem(g1,,"Item 2"),1) = 2]
	endwith
	// var_Items.CellState(var_Items.ItemByIndex(3),0) = 1
	with (oG2antt)
		TemplateDef = [dim var_Items]
		TemplateDef = var_Items
		Template = [var_Items.CellState(ItemByIndex(3),0) = 1]
	endwith
	g2 = var_Items.InsertItem(r,null,"Group B")
	// var_Items.CellValue(var_Items.InsertItem(g2,null,"Item 3"),1) = 3
	with (oG2antt)
		TemplateDef = [dim var_Items]
		TemplateDef = var_Items
		Template = [var_Items.CellValue(InsertItem(g2,,"Item 3"),1) = 3]
	endwith
	// var_Items.CellValue(var_Items.InsertItem(g2,null,"Item 4"),1) = 4
	with (oG2antt)
		TemplateDef = [dim var_Items]
		TemplateDef = var_Items
		Template = [var_Items.CellValue(InsertItem(g2,,"Item 4"),1) = 4]
	endwith
	// var_Items.ExpandItem(g1) = true
	with (oG2antt)
		TemplateDef = [dim var_Items,g1]
		TemplateDef = var_Items
		TemplateDef = g1
		Template = [var_Items.ExpandItem(g1) = True]
	endwith
	// var_Items.ExpandItem(r) = true
	with (oG2antt)
		TemplateDef = [dim var_Items,r]
		TemplateDef = var_Items
		TemplateDef = r
		Template = [var_Items.ExpandItem(r) = True]
	endwith
	h = var_Items.AddItem("divider")
	// var_Items.ItemDivider(h) = 0
	with (oG2antt)
		TemplateDef = [dim var_Items,h]
		TemplateDef = var_Items
		TemplateDef = h
		Template = [var_Items.ItemDivider(h) = 0]
	endwith
	// var_Items.SelectableItem(h) = false
	with (oG2antt)
		TemplateDef = [dim var_Items,h]
		TemplateDef = var_Items
		TemplateDef = h
		Template = [var_Items.SelectableItem(h) = False]
	endwith
	// var_Items.SortableItem(h) = false
	with (oG2antt)
		TemplateDef = [dim var_Items,h]
		TemplateDef = var_Items
		TemplateDef = h
		Template = [var_Items.SortableItem(h) = False]
	endwith
	// var_Items.ItemHeight(h) = 1
	with (oG2antt)
		TemplateDef = [dim var_Items,h]
		TemplateDef = var_Items
		TemplateDef = h
		Template = [var_Items.ItemHeight(h) = 1]
	endwith
	r = var_Items.AddItem("Root 2")
	g1 = var_Items.InsertItem(r,null,"Group C")
	// var_Items.CellValue(var_Items.InsertItem(g1,null,"Item 5"),1) = 5
	with (oG2antt)
		TemplateDef = [dim var_Items]
		TemplateDef = var_Items
		Template = [var_Items.CellValue(InsertItem(g1,,"Item 5"),1) = 5]
	endwith
	// var_Items.CellValue(var_Items.InsertItem(g1,null,"Item 6"),1) = 6
	with (oG2antt)
		TemplateDef = [dim var_Items]
		TemplateDef = var_Items
		Template = [var_Items.CellValue(InsertItem(g1,,"Item 6"),1) = 6]
	endwith
	// var_Items.SelectItem(var_Items.ItemByIndex(2)) = true
	with (oG2antt)
		TemplateDef = [dim var_Items]
		TemplateDef = var_Items
		Template = [var_Items.SelectItem(ItemByIndex(2)) = True]
	endwith
oG2antt.EndUpdate()
? Str(oG2antt.Export("","only(leaf,sortable,selectable,!divider,!locked)"))
|
|
2376
|
Export only non-divider items
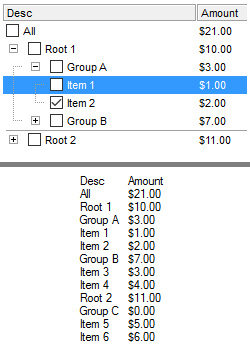
local g1,g2,h,oG2antt,r,var_Column,var_Column1,var_Columns,var_Items

oG2antt = form.EXG2ANTTCHARTACTIVEXCONTROL1.nativeObject
oG2antt.BeginUpdate()
oG2antt.HeaderAppearance = 4
oG2antt.ScrollBySingleLine = true
oG2antt.LinesAtRoot = 5
var_Columns = oG2antt.Columns
	var_Column = var_Columns.Add("Desc")
		var_Column.Width = 32
		// var_Column.Def(0) = true
		with (oG2antt)
			TemplateDef = [dim var_Column]
			TemplateDef = var_Column
			Template = [var_Column.Def(0) = True]
		endwith
	var_Column1 = var_Columns.Add("Amount")
		// var_Column1.Def(20) = "sum(current,rec,%1)"
		with (oG2antt)
			TemplateDef = [dim var_Column1]
			TemplateDef = var_Column1
			Template = [var_Column1.Def(20) = "sum(current,rec,%1)"]
		endwith
		var_Column1.FormatColumn = "currency(value)"
var_Items = oG2antt.Items
	// var_Items.LockedItemCount(0) = 1
	with (oG2antt)
		TemplateDef = [dim var_Items]
		TemplateDef = var_Items
		Template = [var_Items.LockedItemCount(0) = 1]
	endwith
	h = var_Items.LockedItem(0,0)
	// var_Items.CellValue(h,0) = "All"
	with (oG2antt)
		TemplateDef = [dim var_Items,h]
		TemplateDef = var_Items
		TemplateDef = h
		Template = [var_Items.CellValue(h,0) = "All"]
	endwith
	// var_Items.CellValue(h,1) = "sum(all,rec,%1)"
	with (oG2antt)
		TemplateDef = [dim var_Items,h]
		TemplateDef = var_Items
		TemplateDef = h
		Template = [var_Items.CellValue(h,1) = "sum(all,rec,%1)"]
	endwith
	// var_Items.CellValueFormat(h,1) = 4
	with (oG2antt)
		TemplateDef = [dim var_Items,h]
		TemplateDef = var_Items
		TemplateDef = h
		Template = [var_Items.CellValueFormat(h,1) = 4]
	endwith
	r = var_Items.AddItem("Root 1")
	g1 = var_Items.InsertItem(r,null,"Group A")
	// var_Items.CellValue(var_Items.InsertItem(g1,null,"Item 1"),1) = 1
	with (oG2antt)
		TemplateDef = [dim var_Items]
		TemplateDef = var_Items
		Template = [var_Items.CellValue(InsertItem(g1,,"Item 1"),1) = 1]
	endwith
	// var_Items.CellValue(var_Items.InsertItem(g1,null,"Item 2"),1) = 2
	with (oG2antt)
		TemplateDef = [dim var_Items]
		TemplateDef = var_Items
		Template = [var_Items.CellValue(InsertItem(g1,,"Item 2"),1) = 2]
	endwith
	// var_Items.CellState(var_Items.ItemByIndex(3),0) = 1
	with (oG2antt)
		TemplateDef = [dim var_Items]
		TemplateDef = var_Items
		Template = [var_Items.CellState(ItemByIndex(3),0) = 1]
	endwith
	g2 = var_Items.InsertItem(r,null,"Group B")
	// var_Items.CellValue(var_Items.InsertItem(g2,null,"Item 3"),1) = 3
	with (oG2antt)
		TemplateDef = [dim var_Items]
		TemplateDef = var_Items
		Template = [var_Items.CellValue(InsertItem(g2,,"Item 3"),1) = 3]
	endwith
	// var_Items.CellValue(var_Items.InsertItem(g2,null,"Item 4"),1) = 4
	with (oG2antt)
		TemplateDef = [dim var_Items]
		TemplateDef = var_Items
		Template = [var_Items.CellValue(InsertItem(g2,,"Item 4"),1) = 4]
	endwith
	// var_Items.ExpandItem(g1) = true
	with (oG2antt)
		TemplateDef = [dim var_Items,g1]
		TemplateDef = var_Items
		TemplateDef = g1
		Template = [var_Items.ExpandItem(g1) = True]
	endwith
	// var_Items.ExpandItem(r) = true
	with (oG2antt)
		TemplateDef = [dim var_Items,r]
		TemplateDef = var_Items
		TemplateDef = r
		Template = [var_Items.ExpandItem(r) = True]
	endwith
	h = var_Items.AddItem("divider")
	// var_Items.ItemDivider(h) = 0
	with (oG2antt)
		TemplateDef = [dim var_Items,h]
		TemplateDef = var_Items
		TemplateDef = h
		Template = [var_Items.ItemDivider(h) = 0]
	endwith
	// var_Items.SelectableItem(h) = false
	with (oG2antt)
		TemplateDef = [dim var_Items,h]
		TemplateDef = var_Items
		TemplateDef = h
		Template = [var_Items.SelectableItem(h) = False]
	endwith
	// var_Items.SortableItem(h) = false
	with (oG2antt)
		TemplateDef = [dim var_Items,h]
		TemplateDef = var_Items
		TemplateDef = h
		Template = [var_Items.SortableItem(h) = False]
	endwith
	// var_Items.ItemHeight(h) = 1
	with (oG2antt)
		TemplateDef = [dim var_Items,h]
		TemplateDef = var_Items
		TemplateDef = h
		Template = [var_Items.ItemHeight(h) = 1]
	endwith
	r = var_Items.AddItem("Root 2")
	g1 = var_Items.InsertItem(r,null,"Group C")
	// var_Items.CellValue(var_Items.InsertItem(g1,null,"Item 5"),1) = 5
	with (oG2antt)
		TemplateDef = [dim var_Items]
		TemplateDef = var_Items
		Template = [var_Items.CellValue(InsertItem(g1,,"Item 5"),1) = 5]
	endwith
	// var_Items.CellValue(var_Items.InsertItem(g1,null,"Item 6"),1) = 6
	with (oG2antt)
		TemplateDef = [dim var_Items]
		TemplateDef = var_Items
		Template = [var_Items.CellValue(InsertItem(g1,,"Item 6"),1) = 6]
	endwith
	// var_Items.SelectItem(var_Items.ItemByIndex(2)) = true
	with (oG2antt)
		TemplateDef = [dim var_Items]
		TemplateDef = var_Items
		Template = [var_Items.SelectItem(ItemByIndex(2)) = True]
	endwith
oG2antt.EndUpdate()
? Str(oG2antt.Export("","only(!divider)"))
|
|
2375
|
Export only selectable items
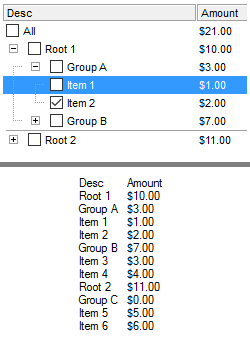
local g1,g2,h,oG2antt,r,var_Column,var_Column1,var_Columns,var_Items

oG2antt = form.EXG2ANTTCHARTACTIVEXCONTROL1.nativeObject
oG2antt.BeginUpdate()
oG2antt.HeaderAppearance = 4
oG2antt.ScrollBySingleLine = true
oG2antt.LinesAtRoot = 5
var_Columns = oG2antt.Columns
	var_Column = var_Columns.Add("Desc")
		var_Column.Width = 32
		// var_Column.Def(0) = true
		with (oG2antt)
			TemplateDef = [dim var_Column]
			TemplateDef = var_Column
			Template = [var_Column.Def(0) = True]
		endwith
	var_Column1 = var_Columns.Add("Amount")
		// var_Column1.Def(20) = "sum(current,rec,%1)"
		with (oG2antt)
			TemplateDef = [dim var_Column1]
			TemplateDef = var_Column1
			Template = [var_Column1.Def(20) = "sum(current,rec,%1)"]
		endwith
		var_Column1.FormatColumn = "currency(value)"
var_Items = oG2antt.Items
	// var_Items.LockedItemCount(0) = 1
	with (oG2antt)
		TemplateDef = [dim var_Items]
		TemplateDef = var_Items
		Template = [var_Items.LockedItemCount(0) = 1]
	endwith
	h = var_Items.LockedItem(0,0)
	// var_Items.CellValue(h,0) = "All"
	with (oG2antt)
		TemplateDef = [dim var_Items,h]
		TemplateDef = var_Items
		TemplateDef = h
		Template = [var_Items.CellValue(h,0) = "All"]
	endwith
	// var_Items.CellValue(h,1) = "sum(all,rec,%1)"
	with (oG2antt)
		TemplateDef = [dim var_Items,h]
		TemplateDef = var_Items
		TemplateDef = h
		Template = [var_Items.CellValue(h,1) = "sum(all,rec,%1)"]
	endwith
	// var_Items.CellValueFormat(h,1) = 4
	with (oG2antt)
		TemplateDef = [dim var_Items,h]
		TemplateDef = var_Items
		TemplateDef = h
		Template = [var_Items.CellValueFormat(h,1) = 4]
	endwith
	r = var_Items.AddItem("Root 1")
	g1 = var_Items.InsertItem(r,null,"Group A")
	// var_Items.CellValue(var_Items.InsertItem(g1,null,"Item 1"),1) = 1
	with (oG2antt)
		TemplateDef = [dim var_Items]
		TemplateDef = var_Items
		Template = [var_Items.CellValue(InsertItem(g1,,"Item 1"),1) = 1]
	endwith
	// var_Items.CellValue(var_Items.InsertItem(g1,null,"Item 2"),1) = 2
	with (oG2antt)
		TemplateDef = [dim var_Items]
		TemplateDef = var_Items
		Template = [var_Items.CellValue(InsertItem(g1,,"Item 2"),1) = 2]
	endwith
	// var_Items.CellState(var_Items.ItemByIndex(3),0) = 1
	with (oG2antt)
		TemplateDef = [dim var_Items]
		TemplateDef = var_Items
		Template = [var_Items.CellState(ItemByIndex(3),0) = 1]
	endwith
	g2 = var_Items.InsertItem(r,null,"Group B")
	// var_Items.CellValue(var_Items.InsertItem(g2,null,"Item 3"),1) = 3
	with (oG2antt)
		TemplateDef = [dim var_Items]
		TemplateDef = var_Items
		Template = [var_Items.CellValue(InsertItem(g2,,"Item 3"),1) = 3]
	endwith
	// var_Items.CellValue(var_Items.InsertItem(g2,null,"Item 4"),1) = 4
	with (oG2antt)
		TemplateDef = [dim var_Items]
		TemplateDef = var_Items
		Template = [var_Items.CellValue(InsertItem(g2,,"Item 4"),1) = 4]
	endwith
	// var_Items.ExpandItem(g1) = true
	with (oG2antt)
		TemplateDef = [dim var_Items,g1]
		TemplateDef = var_Items
		TemplateDef = g1
		Template = [var_Items.ExpandItem(g1) = True]
	endwith
	// var_Items.ExpandItem(r) = true
	with (oG2antt)
		TemplateDef = [dim var_Items,r]
		TemplateDef = var_Items
		TemplateDef = r
		Template = [var_Items.ExpandItem(r) = True]
	endwith
	h = var_Items.AddItem("divider")
	// var_Items.ItemDivider(h) = 0
	with (oG2antt)
		TemplateDef = [dim var_Items,h]
		TemplateDef = var_Items
		TemplateDef = h
		Template = [var_Items.ItemDivider(h) = 0]
	endwith
	// var_Items.SelectableItem(h) = false
	with (oG2antt)
		TemplateDef = [dim var_Items,h]
		TemplateDef = var_Items
		TemplateDef = h
		Template = [var_Items.SelectableItem(h) = False]
	endwith
	// var_Items.SortableItem(h) = false
	with (oG2antt)
		TemplateDef = [dim var_Items,h]
		TemplateDef = var_Items
		TemplateDef = h
		Template = [var_Items.SortableItem(h) = False]
	endwith
	// var_Items.ItemHeight(h) = 1
	with (oG2antt)
		TemplateDef = [dim var_Items,h]
		TemplateDef = var_Items
		TemplateDef = h
		Template = [var_Items.ItemHeight(h) = 1]
	endwith
	r = var_Items.AddItem("Root 2")
	g1 = var_Items.InsertItem(r,null,"Group C")
	// var_Items.CellValue(var_Items.InsertItem(g1,null,"Item 5"),1) = 5
	with (oG2antt)
		TemplateDef = [dim var_Items]
		TemplateDef = var_Items
		Template = [var_Items.CellValue(InsertItem(g1,,"Item 5"),1) = 5]
	endwith
	// var_Items.CellValue(var_Items.InsertItem(g1,null,"Item 6"),1) = 6
	with (oG2antt)
		TemplateDef = [dim var_Items]
		TemplateDef = var_Items
		Template = [var_Items.CellValue(InsertItem(g1,,"Item 6"),1) = 6]
	endwith
	// var_Items.SelectItem(var_Items.ItemByIndex(2)) = true
	with (oG2antt)
		TemplateDef = [dim var_Items]
		TemplateDef = var_Items
		Template = [var_Items.SelectItem(ItemByIndex(2)) = True]
	endwith
oG2antt.EndUpdate()
? Str(oG2antt.Export("","only(selectable)"))
|
|
2374
|
Export only sortable, but not locked items

local g1,g2,h,oG2antt,r,var_Column,var_Column1,var_Columns,var_Items

oG2antt = form.EXG2ANTTCHARTACTIVEXCONTROL1.nativeObject
oG2antt.BeginUpdate()
oG2antt.HeaderAppearance = 4
oG2antt.ScrollBySingleLine = true
oG2antt.LinesAtRoot = 5
var_Columns = oG2antt.Columns
	var_Column = var_Columns.Add("Desc")
		var_Column.Width = 32
		// var_Column.Def(0) = true
		with (oG2antt)
			TemplateDef = [dim var_Column]
			TemplateDef = var_Column
			Template = [var_Column.Def(0) = True]
		endwith
	var_Column1 = var_Columns.Add("Amount")
		// var_Column1.Def(20) = "sum(current,rec,%1)"
		with (oG2antt)
			TemplateDef = [dim var_Column1]
			TemplateDef = var_Column1
			Template = [var_Column1.Def(20) = "sum(current,rec,%1)"]
		endwith
		var_Column1.FormatColumn = "currency(value)"
var_Items = oG2antt.Items
	// var_Items.LockedItemCount(0) = 1
	with (oG2antt)
		TemplateDef = [dim var_Items]
		TemplateDef = var_Items
		Template = [var_Items.LockedItemCount(0) = 1]
	endwith
	h = var_Items.LockedItem(0,0)
	// var_Items.CellValue(h,0) = "All"
	with (oG2antt)
		TemplateDef = [dim var_Items,h]
		TemplateDef = var_Items
		TemplateDef = h
		Template = [var_Items.CellValue(h,0) = "All"]
	endwith
	// var_Items.CellValue(h,1) = "sum(all,rec,%1)"
	with (oG2antt)
		TemplateDef = [dim var_Items,h]
		TemplateDef = var_Items
		TemplateDef = h
		Template = [var_Items.CellValue(h,1) = "sum(all,rec,%1)"]
	endwith
	// var_Items.CellValueFormat(h,1) = 4
	with (oG2antt)
		TemplateDef = [dim var_Items,h]
		TemplateDef = var_Items
		TemplateDef = h
		Template = [var_Items.CellValueFormat(h,1) = 4]
	endwith
	r = var_Items.AddItem("Root 1")
	g1 = var_Items.InsertItem(r,null,"Group A")
	// var_Items.CellValue(var_Items.InsertItem(g1,null,"Item 1"),1) = 1
	with (oG2antt)
		TemplateDef = [dim var_Items]
		TemplateDef = var_Items
		Template = [var_Items.CellValue(InsertItem(g1,,"Item 1"),1) = 1]
	endwith
	// var_Items.CellValue(var_Items.InsertItem(g1,null,"Item 2"),1) = 2
	with (oG2antt)
		TemplateDef = [dim var_Items]
		TemplateDef = var_Items
		Template = [var_Items.CellValue(InsertItem(g1,,"Item 2"),1) = 2]
	endwith
	// var_Items.CellState(var_Items.ItemByIndex(3),0) = 1
	with (oG2antt)
		TemplateDef = [dim var_Items]
		TemplateDef = var_Items
		Template = [var_Items.CellState(ItemByIndex(3),0) = 1]
	endwith
	g2 = var_Items.InsertItem(r,null,"Group B")
	// var_Items.CellValue(var_Items.InsertItem(g2,null,"Item 3"),1) = 3
	with (oG2antt)
		TemplateDef = [dim var_Items]
		TemplateDef = var_Items
		Template = [var_Items.CellValue(InsertItem(g2,,"Item 3"),1) = 3]
	endwith
	// var_Items.CellValue(var_Items.InsertItem(g2,null,"Item 4"),1) = 4
	with (oG2antt)
		TemplateDef = [dim var_Items]
		TemplateDef = var_Items
		Template = [var_Items.CellValue(InsertItem(g2,,"Item 4"),1) = 4]
	endwith
	// var_Items.ExpandItem(g1) = true
	with (oG2antt)
		TemplateDef = [dim var_Items,g1]
		TemplateDef = var_Items
		TemplateDef = g1
		Template = [var_Items.ExpandItem(g1) = True]
	endwith
	// var_Items.ExpandItem(r) = true
	with (oG2antt)
		TemplateDef = [dim var_Items,r]
		TemplateDef = var_Items
		TemplateDef = r
		Template = [var_Items.ExpandItem(r) = True]
	endwith
	h = var_Items.AddItem("divider")
	// var_Items.ItemDivider(h) = 0
	with (oG2antt)
		TemplateDef = [dim var_Items,h]
		TemplateDef = var_Items
		TemplateDef = h
		Template = [var_Items.ItemDivider(h) = 0]
	endwith
	// var_Items.SelectableItem(h) = false
	with (oG2antt)
		TemplateDef = [dim var_Items,h]
		TemplateDef = var_Items
		TemplateDef = h
		Template = [var_Items.SelectableItem(h) = False]
	endwith
	// var_Items.SortableItem(h) = false
	with (oG2antt)
		TemplateDef = [dim var_Items,h]
		TemplateDef = var_Items
		TemplateDef = h
		Template = [var_Items.SortableItem(h) = False]
	endwith
	// var_Items.ItemHeight(h) = 1
	with (oG2antt)
		TemplateDef = [dim var_Items,h]
		TemplateDef = var_Items
		TemplateDef = h
		Template = [var_Items.ItemHeight(h) = 1]
	endwith
	r = var_Items.AddItem("Root 2")
	g1 = var_Items.InsertItem(r,null,"Group C")
	// var_Items.CellValue(var_Items.InsertItem(g1,null,"Item 5"),1) = 5
	with (oG2antt)
		TemplateDef = [dim var_Items]
		TemplateDef = var_Items
		Template = [var_Items.CellValue(InsertItem(g1,,"Item 5"),1) = 5]
	endwith
	// var_Items.CellValue(var_Items.InsertItem(g1,null,"Item 6"),1) = 6
	with (oG2antt)
		TemplateDef = [dim var_Items]
		TemplateDef = var_Items
		Template = [var_Items.CellValue(InsertItem(g1,,"Item 6"),1) = 6]
	endwith
	// var_Items.SelectItem(var_Items.ItemByIndex(2)) = true
	with (oG2antt)
		TemplateDef = [dim var_Items]
		TemplateDef = var_Items
		Template = [var_Items.SelectItem(ItemByIndex(2)) = True]
	endwith
oG2antt.EndUpdate()
? Str(oG2antt.Export("","only(sortable,!locked)"))
|
|
2373
|
Export only checked items on specified column
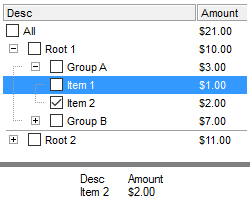
local g1,g2,h,oG2antt,r,var_Column,var_Column1,var_Columns,var_Items

oG2antt = form.EXG2ANTTCHARTACTIVEXCONTROL1.nativeObject
oG2antt.BeginUpdate()
oG2antt.HeaderAppearance = 4
oG2antt.ScrollBySingleLine = true
oG2antt.LinesAtRoot = 5
var_Columns = oG2antt.Columns
	var_Column = var_Columns.Add("Desc")
		var_Column.Width = 32
		// var_Column.Def(0) = true
		with (oG2antt)
			TemplateDef = [dim var_Column]
			TemplateDef = var_Column
			Template = [var_Column.Def(0) = True]
		endwith
	var_Column1 = var_Columns.Add("Amount")
		// var_Column1.Def(20) = "sum(current,rec,%1)"
		with (oG2antt)
			TemplateDef = [dim var_Column1]
			TemplateDef = var_Column1
			Template = [var_Column1.Def(20) = "sum(current,rec,%1)"]
		endwith
		var_Column1.FormatColumn = "currency(value)"
var_Items = oG2antt.Items
	// var_Items.LockedItemCount(0) = 1
	with (oG2antt)
		TemplateDef = [dim var_Items]
		TemplateDef = var_Items
		Template = [var_Items.LockedItemCount(0) = 1]
	endwith
	h = var_Items.LockedItem(0,0)
	// var_Items.CellValue(h,0) = "All"
	with (oG2antt)
		TemplateDef = [dim var_Items,h]
		TemplateDef = var_Items
		TemplateDef = h
		Template = [var_Items.CellValue(h,0) = "All"]
	endwith
	// var_Items.CellValue(h,1) = "sum(all,rec,%1)"
	with (oG2antt)
		TemplateDef = [dim var_Items,h]
		TemplateDef = var_Items
		TemplateDef = h
		Template = [var_Items.CellValue(h,1) = "sum(all,rec,%1)"]
	endwith
	// var_Items.CellValueFormat(h,1) = 4
	with (oG2antt)
		TemplateDef = [dim var_Items,h]
		TemplateDef = var_Items
		TemplateDef = h
		Template = [var_Items.CellValueFormat(h,1) = 4]
	endwith
	r = var_Items.AddItem("Root 1")
	g1 = var_Items.InsertItem(r,null,"Group A")
	// var_Items.CellValue(var_Items.InsertItem(g1,null,"Item 1"),1) = 1
	with (oG2antt)
		TemplateDef = [dim var_Items]
		TemplateDef = var_Items
		Template = [var_Items.CellValue(InsertItem(g1,,"Item 1"),1) = 1]
	endwith
	// var_Items.CellValue(var_Items.InsertItem(g1,null,"Item 2"),1) = 2
	with (oG2antt)
		TemplateDef = [dim var_Items]
		TemplateDef = var_Items
		Template = [var_Items.CellValue(InsertItem(g1,,"Item 2"),1) = 2]
	endwith
	// var_Items.CellState(var_Items.ItemByIndex(3),0) = 1
	with (oG2antt)
		TemplateDef = [dim var_Items]
		TemplateDef = var_Items
		Template = [var_Items.CellState(ItemByIndex(3),0) = 1]
	endwith
	g2 = var_Items.InsertItem(r,null,"Group B")
	// var_Items.CellValue(var_Items.InsertItem(g2,null,"Item 3"),1) = 3
	with (oG2antt)
		TemplateDef = [dim var_Items]
		TemplateDef = var_Items
		Template = [var_Items.CellValue(InsertItem(g2,,"Item 3"),1) = 3]
	endwith
	// var_Items.CellValue(var_Items.InsertItem(g2,null,"Item 4"),1) = 4
	with (oG2antt)
		TemplateDef = [dim var_Items]
		TemplateDef = var_Items
		Template = [var_Items.CellValue(InsertItem(g2,,"Item 4"),1) = 4]
	endwith
	// var_Items.ExpandItem(g1) = true
	with (oG2antt)
		TemplateDef = [dim var_Items,g1]
		TemplateDef = var_Items
		TemplateDef = g1
		Template = [var_Items.ExpandItem(g1) = True]
	endwith
	// var_Items.ExpandItem(r) = true
	with (oG2antt)
		TemplateDef = [dim var_Items,r]
		TemplateDef = var_Items
		TemplateDef = r
		Template = [var_Items.ExpandItem(r) = True]
	endwith
	h = var_Items.AddItem("divider")
	// var_Items.ItemDivider(h) = 0
	with (oG2antt)
		TemplateDef = [dim var_Items,h]
		TemplateDef = var_Items
		TemplateDef = h
		Template = [var_Items.ItemDivider(h) = 0]
	endwith
	// var_Items.SelectableItem(h) = false
	with (oG2antt)
		TemplateDef = [dim var_Items,h]
		TemplateDef = var_Items
		TemplateDef = h
		Template = [var_Items.SelectableItem(h) = False]
	endwith
	// var_Items.SortableItem(h) = false
	with (oG2antt)
		TemplateDef = [dim var_Items,h]
		TemplateDef = var_Items
		TemplateDef = h
		Template = [var_Items.SortableItem(h) = False]
	endwith
	// var_Items.ItemHeight(h) = 1
	with (oG2antt)
		TemplateDef = [dim var_Items,h]
		TemplateDef = var_Items
		TemplateDef = h
		Template = [var_Items.ItemHeight(h) = 1]
	endwith
	r = var_Items.AddItem("Root 2")
	g1 = var_Items.InsertItem(r,null,"Group C")
	// var_Items.CellValue(var_Items.InsertItem(g1,null,"Item 5"),1) = 5
	with (oG2antt)
		TemplateDef = [dim var_Items]
		TemplateDef = var_Items
		Template = [var_Items.CellValue(InsertItem(g1,,"Item 5"),1) = 5]
	endwith
	// var_Items.CellValue(var_Items.InsertItem(g1,null,"Item 6"),1) = 6
	with (oG2antt)
		TemplateDef = [dim var_Items]
		TemplateDef = var_Items
		Template = [var_Items.CellValue(InsertItem(g1,,"Item 6"),1) = 6]
	endwith
	// var_Items.SelectItem(var_Items.ItemByIndex(2)) = true
	with (oG2antt)
		TemplateDef = [dim var_Items]
		TemplateDef = var_Items
		Template = [var_Items.SelectItem(ItemByIndex(2)) = True]
	endwith
oG2antt.EndUpdate()
? Str(oG2antt.Export("","only(checked[0])"))
|
|
2372
|
Export only filtered, not locked or divider items
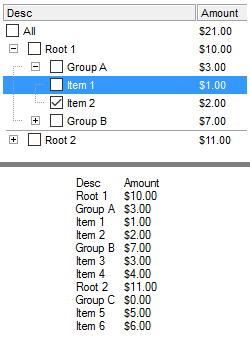
local g1,g2,h,oG2antt,r,var_Column,var_Column1,var_Columns,var_Items

oG2antt = form.EXG2ANTTCHARTACTIVEXCONTROL1.nativeObject
oG2antt.BeginUpdate()
oG2antt.HeaderAppearance = 4
oG2antt.ScrollBySingleLine = true
oG2antt.LinesAtRoot = 5
var_Columns = oG2antt.Columns
	var_Column = var_Columns.Add("Desc")
		var_Column.Width = 32
		// var_Column.Def(0) = true
		with (oG2antt)
			TemplateDef = [dim var_Column]
			TemplateDef = var_Column
			Template = [var_Column.Def(0) = True]
		endwith
	var_Column1 = var_Columns.Add("Amount")
		// var_Column1.Def(20) = "sum(current,rec,%1)"
		with (oG2antt)
			TemplateDef = [dim var_Column1]
			TemplateDef = var_Column1
			Template = [var_Column1.Def(20) = "sum(current,rec,%1)"]
		endwith
		var_Column1.FormatColumn = "currency(value)"
var_Items = oG2antt.Items
	// var_Items.LockedItemCount(0) = 1
	with (oG2antt)
		TemplateDef = [dim var_Items]
		TemplateDef = var_Items
		Template = [var_Items.LockedItemCount(0) = 1]
	endwith
	h = var_Items.LockedItem(0,0)
	// var_Items.CellValue(h,0) = "All"
	with (oG2antt)
		TemplateDef = [dim var_Items,h]
		TemplateDef = var_Items
		TemplateDef = h
		Template = [var_Items.CellValue(h,0) = "All"]
	endwith
	// var_Items.CellValue(h,1) = "sum(all,rec,%1)"
	with (oG2antt)
		TemplateDef = [dim var_Items,h]
		TemplateDef = var_Items
		TemplateDef = h
		Template = [var_Items.CellValue(h,1) = "sum(all,rec,%1)"]
	endwith
	// var_Items.CellValueFormat(h,1) = 4
	with (oG2antt)
		TemplateDef = [dim var_Items,h]
		TemplateDef = var_Items
		TemplateDef = h
		Template = [var_Items.CellValueFormat(h,1) = 4]
	endwith
	r = var_Items.AddItem("Root 1")
	g1 = var_Items.InsertItem(r,null,"Group A")
	// var_Items.CellValue(var_Items.InsertItem(g1,null,"Item 1"),1) = 1
	with (oG2antt)
		TemplateDef = [dim var_Items]
		TemplateDef = var_Items
		Template = [var_Items.CellValue(InsertItem(g1,,"Item 1"),1) = 1]
	endwith
	// var_Items.CellValue(var_Items.InsertItem(g1,null,"Item 2"),1) = 2
	with (oG2antt)
		TemplateDef = [dim var_Items]
		TemplateDef = var_Items
		Template = [var_Items.CellValue(InsertItem(g1,,"Item 2"),1) = 2]
	endwith
	// var_Items.CellState(var_Items.ItemByIndex(3),0) = 1
	with (oG2antt)
		TemplateDef = [dim var_Items]
		TemplateDef = var_Items
		Template = [var_Items.CellState(ItemByIndex(3),0) = 1]
	endwith
	g2 = var_Items.InsertItem(r,null,"Group B")
	// var_Items.CellValue(var_Items.InsertItem(g2,null,"Item 3"),1) = 3
	with (oG2antt)
		TemplateDef = [dim var_Items]
		TemplateDef = var_Items
		Template = [var_Items.CellValue(InsertItem(g2,,"Item 3"),1) = 3]
	endwith
	// var_Items.CellValue(var_Items.InsertItem(g2,null,"Item 4"),1) = 4
	with (oG2antt)
		TemplateDef = [dim var_Items]
		TemplateDef = var_Items
		Template = [var_Items.CellValue(InsertItem(g2,,"Item 4"),1) = 4]
	endwith
	// var_Items.ExpandItem(g1) = true
	with (oG2antt)
		TemplateDef = [dim var_Items,g1]
		TemplateDef = var_Items
		TemplateDef = g1
		Template = [var_Items.ExpandItem(g1) = True]
	endwith
	// var_Items.ExpandItem(r) = true
	with (oG2antt)
		TemplateDef = [dim var_Items,r]
		TemplateDef = var_Items
		TemplateDef = r
		Template = [var_Items.ExpandItem(r) = True]
	endwith
	h = var_Items.AddItem("divider")
	// var_Items.ItemDivider(h) = 0
	with (oG2antt)
		TemplateDef = [dim var_Items,h]
		TemplateDef = var_Items
		TemplateDef = h
		Template = [var_Items.ItemDivider(h) = 0]
	endwith
	// var_Items.SelectableItem(h) = false
	with (oG2antt)
		TemplateDef = [dim var_Items,h]
		TemplateDef = var_Items
		TemplateDef = h
		Template = [var_Items.SelectableItem(h) = False]
	endwith
	// var_Items.SortableItem(h) = false
	with (oG2antt)
		TemplateDef = [dim var_Items,h]
		TemplateDef = var_Items
		TemplateDef = h
		Template = [var_Items.SortableItem(h) = False]
	endwith
	// var_Items.ItemHeight(h) = 1
	with (oG2antt)
		TemplateDef = [dim var_Items,h]
		TemplateDef = var_Items
		TemplateDef = h
		Template = [var_Items.ItemHeight(h) = 1]
	endwith
	r = var_Items.AddItem("Root 2")
	g1 = var_Items.InsertItem(r,null,"Group C")
	// var_Items.CellValue(var_Items.InsertItem(g1,null,"Item 5"),1) = 5
	with (oG2antt)
		TemplateDef = [dim var_Items]
		TemplateDef = var_Items
		Template = [var_Items.CellValue(InsertItem(g1,,"Item 5"),1) = 5]
	endwith
	// var_Items.CellValue(var_Items.InsertItem(g1,null,"Item 6"),1) = 6
	with (oG2antt)
		TemplateDef = [dim var_Items]
		TemplateDef = var_Items
		Template = [var_Items.CellValue(InsertItem(g1,,"Item 6"),1) = 6]
	endwith
	// var_Items.SelectItem(var_Items.ItemByIndex(2)) = true
	with (oG2antt)
		TemplateDef = [dim var_Items]
		TemplateDef = var_Items
		Template = [var_Items.SelectItem(ItemByIndex(2)) = True]
	endwith
oG2antt.EndUpdate()
? Str(oG2antt.Export("","only(visible,!locked,!divider)"))
|
|
2371
|
Export only selected items
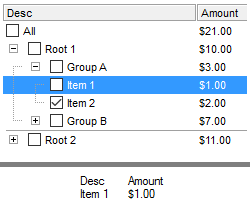
local g1,g2,h,oG2antt,r,var_Column,var_Column1,var_Columns,var_Items

oG2antt = form.EXG2ANTTCHARTACTIVEXCONTROL1.nativeObject
oG2antt.BeginUpdate()
oG2antt.HeaderAppearance = 4
oG2antt.ScrollBySingleLine = true
oG2antt.LinesAtRoot = 5
var_Columns = oG2antt.Columns
	var_Column = var_Columns.Add("Desc")
		var_Column.Width = 32
		// var_Column.Def(0) = true
		with (oG2antt)
			TemplateDef = [dim var_Column]
			TemplateDef = var_Column
			Template = [var_Column.Def(0) = True]
		endwith
	var_Column1 = var_Columns.Add("Amount")
		// var_Column1.Def(20) = "sum(current,rec,%1)"
		with (oG2antt)
			TemplateDef = [dim var_Column1]
			TemplateDef = var_Column1
			Template = [var_Column1.Def(20) = "sum(current,rec,%1)"]
		endwith
		var_Column1.FormatColumn = "currency(value)"
var_Items = oG2antt.Items
	// var_Items.LockedItemCount(0) = 1
	with (oG2antt)
		TemplateDef = [dim var_Items]
		TemplateDef = var_Items
		Template = [var_Items.LockedItemCount(0) = 1]
	endwith
	h = var_Items.LockedItem(0,0)
	// var_Items.CellValue(h,0) = "All"
	with (oG2antt)
		TemplateDef = [dim var_Items,h]
		TemplateDef = var_Items
		TemplateDef = h
		Template = [var_Items.CellValue(h,0) = "All"]
	endwith
	// var_Items.CellValue(h,1) = "sum(all,rec,%1)"
	with (oG2antt)
		TemplateDef = [dim var_Items,h]
		TemplateDef = var_Items
		TemplateDef = h
		Template = [var_Items.CellValue(h,1) = "sum(all,rec,%1)"]
	endwith
	// var_Items.CellValueFormat(h,1) = 4
	with (oG2antt)
		TemplateDef = [dim var_Items,h]
		TemplateDef = var_Items
		TemplateDef = h
		Template = [var_Items.CellValueFormat(h,1) = 4]
	endwith
	r = var_Items.AddItem("Root 1")
	g1 = var_Items.InsertItem(r,null,"Group A")
	// var_Items.CellValue(var_Items.InsertItem(g1,null,"Item 1"),1) = 1
	with (oG2antt)
		TemplateDef = [dim var_Items]
		TemplateDef = var_Items
		Template = [var_Items.CellValue(InsertItem(g1,,"Item 1"),1) = 1]
	endwith
	// var_Items.CellValue(var_Items.InsertItem(g1,null,"Item 2"),1) = 2
	with (oG2antt)
		TemplateDef = [dim var_Items]
		TemplateDef = var_Items
		Template = [var_Items.CellValue(InsertItem(g1,,"Item 2"),1) = 2]
	endwith
	// var_Items.CellState(var_Items.ItemByIndex(3),0) = 1
	with (oG2antt)
		TemplateDef = [dim var_Items]
		TemplateDef = var_Items
		Template = [var_Items.CellState(ItemByIndex(3),0) = 1]
	endwith
	g2 = var_Items.InsertItem(r,null,"Group B")
	// var_Items.CellValue(var_Items.InsertItem(g2,null,"Item 3"),1) = 3
	with (oG2antt)
		TemplateDef = [dim var_Items]
		TemplateDef = var_Items
		Template = [var_Items.CellValue(InsertItem(g2,,"Item 3"),1) = 3]
	endwith
	// var_Items.CellValue(var_Items.InsertItem(g2,null,"Item 4"),1) = 4
	with (oG2antt)
		TemplateDef = [dim var_Items]
		TemplateDef = var_Items
		Template = [var_Items.CellValue(InsertItem(g2,,"Item 4"),1) = 4]
	endwith
	// var_Items.ExpandItem(g1) = true
	with (oG2antt)
		TemplateDef = [dim var_Items,g1]
		TemplateDef = var_Items
		TemplateDef = g1
		Template = [var_Items.ExpandItem(g1) = True]
	endwith
	// var_Items.ExpandItem(r) = true
	with (oG2antt)
		TemplateDef = [dim var_Items,r]
		TemplateDef = var_Items
		TemplateDef = r
		Template = [var_Items.ExpandItem(r) = True]
	endwith
	h = var_Items.AddItem("divider")
	// var_Items.ItemDivider(h) = 0
	with (oG2antt)
		TemplateDef = [dim var_Items,h]
		TemplateDef = var_Items
		TemplateDef = h
		Template = [var_Items.ItemDivider(h) = 0]
	endwith
	// var_Items.SelectableItem(h) = false
	with (oG2antt)
		TemplateDef = [dim var_Items,h]
		TemplateDef = var_Items
		TemplateDef = h
		Template = [var_Items.SelectableItem(h) = False]
	endwith
	// var_Items.SortableItem(h) = false
	with (oG2antt)
		TemplateDef = [dim var_Items,h]
		TemplateDef = var_Items
		TemplateDef = h
		Template = [var_Items.SortableItem(h) = False]
	endwith
	// var_Items.ItemHeight(h) = 1
	with (oG2antt)
		TemplateDef = [dim var_Items,h]
		TemplateDef = var_Items
		TemplateDef = h
		Template = [var_Items.ItemHeight(h) = 1]
	endwith
	r = var_Items.AddItem("Root 2")
	g1 = var_Items.InsertItem(r,null,"Group C")
	// var_Items.CellValue(var_Items.InsertItem(g1,null,"Item 5"),1) = 5
	with (oG2antt)
		TemplateDef = [dim var_Items]
		TemplateDef = var_Items
		Template = [var_Items.CellValue(InsertItem(g1,,"Item 5"),1) = 5]
	endwith
	// var_Items.CellValue(var_Items.InsertItem(g1,null,"Item 6"),1) = 6
	with (oG2antt)
		TemplateDef = [dim var_Items]
		TemplateDef = var_Items
		Template = [var_Items.CellValue(InsertItem(g1,,"Item 6"),1) = 6]
	endwith
	// var_Items.SelectItem(var_Items.ItemByIndex(2)) = true
	with (oG2antt)
		TemplateDef = [dim var_Items]
		TemplateDef = var_Items
		Template = [var_Items.SelectItem(ItemByIndex(2)) = True]
	endwith
oG2antt.EndUpdate()
? Str(oG2antt.Export("","only(selected)"))
|
|
2370
|
Export only locked items
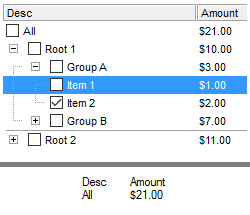
local g1,g2,h,oG2antt,r,var_Column,var_Column1,var_Columns,var_Items

oG2antt = form.EXG2ANTTCHARTACTIVEXCONTROL1.nativeObject
oG2antt.BeginUpdate()
oG2antt.HeaderAppearance = 4
oG2antt.ScrollBySingleLine = true
oG2antt.LinesAtRoot = 5
var_Columns = oG2antt.Columns
	var_Column = var_Columns.Add("Desc")
		var_Column.Width = 32
		// var_Column.Def(0) = true
		with (oG2antt)
			TemplateDef = [dim var_Column]
			TemplateDef = var_Column
			Template = [var_Column.Def(0) = True]
		endwith
	var_Column1 = var_Columns.Add("Amount")
		// var_Column1.Def(20) = "sum(current,rec,%1)"
		with (oG2antt)
			TemplateDef = [dim var_Column1]
			TemplateDef = var_Column1
			Template = [var_Column1.Def(20) = "sum(current,rec,%1)"]
		endwith
		var_Column1.FormatColumn = "currency(value)"
var_Items = oG2antt.Items
	// var_Items.LockedItemCount(0) = 1
	with (oG2antt)
		TemplateDef = [dim var_Items]
		TemplateDef = var_Items
		Template = [var_Items.LockedItemCount(0) = 1]
	endwith
	h = var_Items.LockedItem(0,0)
	// var_Items.CellValue(h,0) = "All"
	with (oG2antt)
		TemplateDef = [dim var_Items,h]
		TemplateDef = var_Items
		TemplateDef = h
		Template = [var_Items.CellValue(h,0) = "All"]
	endwith
	// var_Items.CellValue(h,1) = "sum(all,rec,%1)"
	with (oG2antt)
		TemplateDef = [dim var_Items,h]
		TemplateDef = var_Items
		TemplateDef = h
		Template = [var_Items.CellValue(h,1) = "sum(all,rec,%1)"]
	endwith
	// var_Items.CellValueFormat(h,1) = 4
	with (oG2antt)
		TemplateDef = [dim var_Items,h]
		TemplateDef = var_Items
		TemplateDef = h
		Template = [var_Items.CellValueFormat(h,1) = 4]
	endwith
	r = var_Items.AddItem("Root 1")
	g1 = var_Items.InsertItem(r,null,"Group A")
	// var_Items.CellValue(var_Items.InsertItem(g1,null,"Item 1"),1) = 1
	with (oG2antt)
		TemplateDef = [dim var_Items]
		TemplateDef = var_Items
		Template = [var_Items.CellValue(InsertItem(g1,,"Item 1"),1) = 1]
	endwith
	// var_Items.CellValue(var_Items.InsertItem(g1,null,"Item 2"),1) = 2
	with (oG2antt)
		TemplateDef = [dim var_Items]
		TemplateDef = var_Items
		Template = [var_Items.CellValue(InsertItem(g1,,"Item 2"),1) = 2]
	endwith
	// var_Items.CellState(var_Items.ItemByIndex(3),0) = 1
	with (oG2antt)
		TemplateDef = [dim var_Items]
		TemplateDef = var_Items
		Template = [var_Items.CellState(ItemByIndex(3),0) = 1]
	endwith
	g2 = var_Items.InsertItem(r,null,"Group B")
	// var_Items.CellValue(var_Items.InsertItem(g2,null,"Item 3"),1) = 3
	with (oG2antt)
		TemplateDef = [dim var_Items]
		TemplateDef = var_Items
		Template = [var_Items.CellValue(InsertItem(g2,,"Item 3"),1) = 3]
	endwith
	// var_Items.CellValue(var_Items.InsertItem(g2,null,"Item 4"),1) = 4
	with (oG2antt)
		TemplateDef = [dim var_Items]
		TemplateDef = var_Items
		Template = [var_Items.CellValue(InsertItem(g2,,"Item 4"),1) = 4]
	endwith
	// var_Items.ExpandItem(g1) = true
	with (oG2antt)
		TemplateDef = [dim var_Items,g1]
		TemplateDef = var_Items
		TemplateDef = g1
		Template = [var_Items.ExpandItem(g1) = True]
	endwith
	// var_Items.ExpandItem(r) = true
	with (oG2antt)
		TemplateDef = [dim var_Items,r]
		TemplateDef = var_Items
		TemplateDef = r
		Template = [var_Items.ExpandItem(r) = True]
	endwith
	h = var_Items.AddItem("divider")
	// var_Items.ItemDivider(h) = 0
	with (oG2antt)
		TemplateDef = [dim var_Items,h]
		TemplateDef = var_Items
		TemplateDef = h
		Template = [var_Items.ItemDivider(h) = 0]
	endwith
	// var_Items.SelectableItem(h) = false
	with (oG2antt)
		TemplateDef = [dim var_Items,h]
		TemplateDef = var_Items
		TemplateDef = h
		Template = [var_Items.SelectableItem(h) = False]
	endwith
	// var_Items.SortableItem(h) = false
	with (oG2antt)
		TemplateDef = [dim var_Items,h]
		TemplateDef = var_Items
		TemplateDef = h
		Template = [var_Items.SortableItem(h) = False]
	endwith
	// var_Items.ItemHeight(h) = 1
	with (oG2antt)
		TemplateDef = [dim var_Items,h]
		TemplateDef = var_Items
		TemplateDef = h
		Template = [var_Items.ItemHeight(h) = 1]
	endwith
	r = var_Items.AddItem("Root 2")
	g1 = var_Items.InsertItem(r,null,"Group C")
	// var_Items.CellValue(var_Items.InsertItem(g1,null,"Item 5"),1) = 5
	with (oG2antt)
		TemplateDef = [dim var_Items]
		TemplateDef = var_Items
		Template = [var_Items.CellValue(InsertItem(g1,,"Item 5"),1) = 5]
	endwith
	// var_Items.CellValue(var_Items.InsertItem(g1,null,"Item 6"),1) = 6
	with (oG2antt)
		TemplateDef = [dim var_Items]
		TemplateDef = var_Items
		Template = [var_Items.CellValue(InsertItem(g1,,"Item 6"),1) = 6]
	endwith
	// var_Items.SelectItem(var_Items.ItemByIndex(2)) = true
	with (oG2antt)
		TemplateDef = [dim var_Items]
		TemplateDef = var_Items
		Template = [var_Items.SelectItem(ItemByIndex(2)) = True]
	endwith
oG2antt.EndUpdate()
? Str(oG2antt.Export("","only(locked)"))
|
|
2369
|
Export the leaf items of the control, excluding parent or grouped items
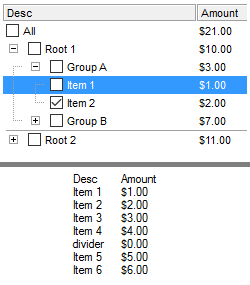
local g1,g2,h,oG2antt,r,var_Column,var_Column1,var_Columns,var_Items

oG2antt = form.EXG2ANTTCHARTACTIVEXCONTROL1.nativeObject
oG2antt.BeginUpdate()
oG2antt.HeaderAppearance = 4
oG2antt.ScrollBySingleLine = true
oG2antt.LinesAtRoot = 5
var_Columns = oG2antt.Columns
	var_Column = var_Columns.Add("Desc")
		var_Column.Width = 32
		// var_Column.Def(0) = true
		with (oG2antt)
			TemplateDef = [dim var_Column]
			TemplateDef = var_Column
			Template = [var_Column.Def(0) = True]
		endwith
	var_Column1 = var_Columns.Add("Amount")
		// var_Column1.Def(20) = "sum(current,rec,%1)"
		with (oG2antt)
			TemplateDef = [dim var_Column1]
			TemplateDef = var_Column1
			Template = [var_Column1.Def(20) = "sum(current,rec,%1)"]
		endwith
		var_Column1.FormatColumn = "currency(value)"
var_Items = oG2antt.Items
	// var_Items.LockedItemCount(0) = 1
	with (oG2antt)
		TemplateDef = [dim var_Items]
		TemplateDef = var_Items
		Template = [var_Items.LockedItemCount(0) = 1]
	endwith
	h = var_Items.LockedItem(0,0)
	// var_Items.CellValue(h,0) = "All"
	with (oG2antt)
		TemplateDef = [dim var_Items,h]
		TemplateDef = var_Items
		TemplateDef = h
		Template = [var_Items.CellValue(h,0) = "All"]
	endwith
	// var_Items.CellValue(h,1) = "sum(all,rec,%1)"
	with (oG2antt)
		TemplateDef = [dim var_Items,h]
		TemplateDef = var_Items
		TemplateDef = h
		Template = [var_Items.CellValue(h,1) = "sum(all,rec,%1)"]
	endwith
	// var_Items.CellValueFormat(h,1) = 4
	with (oG2antt)
		TemplateDef = [dim var_Items,h]
		TemplateDef = var_Items
		TemplateDef = h
		Template = [var_Items.CellValueFormat(h,1) = 4]
	endwith
	r = var_Items.AddItem("Root 1")
	g1 = var_Items.InsertItem(r,null,"Group A")
	// var_Items.CellValue(var_Items.InsertItem(g1,null,"Item 1"),1) = 1
	with (oG2antt)
		TemplateDef = [dim var_Items]
		TemplateDef = var_Items
		Template = [var_Items.CellValue(InsertItem(g1,,"Item 1"),1) = 1]
	endwith
	// var_Items.CellValue(var_Items.InsertItem(g1,null,"Item 2"),1) = 2
	with (oG2antt)
		TemplateDef = [dim var_Items]
		TemplateDef = var_Items
		Template = [var_Items.CellValue(InsertItem(g1,,"Item 2"),1) = 2]
	endwith
	// var_Items.CellState(var_Items.ItemByIndex(3),0) = 1
	with (oG2antt)
		TemplateDef = [dim var_Items]
		TemplateDef = var_Items
		Template = [var_Items.CellState(ItemByIndex(3),0) = 1]
	endwith
	g2 = var_Items.InsertItem(r,null,"Group B")
	// var_Items.CellValue(var_Items.InsertItem(g2,null,"Item 3"),1) = 3
	with (oG2antt)
		TemplateDef = [dim var_Items]
		TemplateDef = var_Items
		Template = [var_Items.CellValue(InsertItem(g2,,"Item 3"),1) = 3]
	endwith
	// var_Items.CellValue(var_Items.InsertItem(g2,null,"Item 4"),1) = 4
	with (oG2antt)
		TemplateDef = [dim var_Items]
		TemplateDef = var_Items
		Template = [var_Items.CellValue(InsertItem(g2,,"Item 4"),1) = 4]
	endwith
	// var_Items.ExpandItem(g1) = true
	with (oG2antt)
		TemplateDef = [dim var_Items,g1]
		TemplateDef = var_Items
		TemplateDef = g1
		Template = [var_Items.ExpandItem(g1) = True]
	endwith
	// var_Items.ExpandItem(r) = true
	with (oG2antt)
		TemplateDef = [dim var_Items,r]
		TemplateDef = var_Items
		TemplateDef = r
		Template = [var_Items.ExpandItem(r) = True]
	endwith
	h = var_Items.AddItem("divider")
	// var_Items.ItemDivider(h) = 0
	with (oG2antt)
		TemplateDef = [dim var_Items,h]
		TemplateDef = var_Items
		TemplateDef = h
		Template = [var_Items.ItemDivider(h) = 0]
	endwith
	// var_Items.SelectableItem(h) = false
	with (oG2antt)
		TemplateDef = [dim var_Items,h]
		TemplateDef = var_Items
		TemplateDef = h
		Template = [var_Items.SelectableItem(h) = False]
	endwith
	// var_Items.SortableItem(h) = false
	with (oG2antt)
		TemplateDef = [dim var_Items,h]
		TemplateDef = var_Items
		TemplateDef = h
		Template = [var_Items.SortableItem(h) = False]
	endwith
	// var_Items.ItemHeight(h) = 1
	with (oG2antt)
		TemplateDef = [dim var_Items,h]
		TemplateDef = var_Items
		TemplateDef = h
		Template = [var_Items.ItemHeight(h) = 1]
	endwith
	r = var_Items.AddItem("Root 2")
	g1 = var_Items.InsertItem(r,null,"Group C")
	// var_Items.CellValue(var_Items.InsertItem(g1,null,"Item 5"),1) = 5
	with (oG2antt)
		TemplateDef = [dim var_Items]
		TemplateDef = var_Items
		Template = [var_Items.CellValue(InsertItem(g1,,"Item 5"),1) = 5]
	endwith
	// var_Items.CellValue(var_Items.InsertItem(g1,null,"Item 6"),1) = 6
	with (oG2antt)
		TemplateDef = [dim var_Items]
		TemplateDef = var_Items
		Template = [var_Items.CellValue(InsertItem(g1,,"Item 6"),1) = 6]
	endwith
	// var_Items.SelectItem(var_Items.ItemByIndex(2)) = true
	with (oG2antt)
		TemplateDef = [dim var_Items]
		TemplateDef = var_Items
		Template = [var_Items.SelectItem(ItemByIndex(2)) = True]
	endwith
oG2antt.EndUpdate()
? Str(oG2antt.Export("","leaf"))
|
|
2368
|
Export all checked and visible items (the first column in the columns list specifies the index of the column used to query the checkbox state)

local g1,g2,h,oG2antt,r,var_Column,var_Column1,var_Columns,var_Items

oG2antt = form.EXG2ANTTCHARTACTIVEXCONTROL1.nativeObject
oG2antt.BeginUpdate()
oG2antt.HeaderAppearance = 4
oG2antt.ScrollBySingleLine = true
oG2antt.LinesAtRoot = 5
var_Columns = oG2antt.Columns
	var_Column = var_Columns.Add("Desc")
		var_Column.Width = 32
		// var_Column.Def(0) = true
		with (oG2antt)
			TemplateDef = [dim var_Column]
			TemplateDef = var_Column
			Template = [var_Column.Def(0) = True]
		endwith
	var_Column1 = var_Columns.Add("Amount")
		// var_Column1.Def(20) = "sum(current,rec,%1)"
		with (oG2antt)
			TemplateDef = [dim var_Column1]
			TemplateDef = var_Column1
			Template = [var_Column1.Def(20) = "sum(current,rec,%1)"]
		endwith
		var_Column1.FormatColumn = "currency(value)"
var_Items = oG2antt.Items
	// var_Items.LockedItemCount(0) = 1
	with (oG2antt)
		TemplateDef = [dim var_Items]
		TemplateDef = var_Items
		Template = [var_Items.LockedItemCount(0) = 1]
	endwith
	h = var_Items.LockedItem(0,0)
	// var_Items.CellValue(h,0) = "All"
	with (oG2antt)
		TemplateDef = [dim var_Items,h]
		TemplateDef = var_Items
		TemplateDef = h
		Template = [var_Items.CellValue(h,0) = "All"]
	endwith
	// var_Items.CellValue(h,1) = "sum(all,rec,%1)"
	with (oG2antt)
		TemplateDef = [dim var_Items,h]
		TemplateDef = var_Items
		TemplateDef = h
		Template = [var_Items.CellValue(h,1) = "sum(all,rec,%1)"]
	endwith
	// var_Items.CellValueFormat(h,1) = 4
	with (oG2antt)
		TemplateDef = [dim var_Items,h]
		TemplateDef = var_Items
		TemplateDef = h
		Template = [var_Items.CellValueFormat(h,1) = 4]
	endwith
	r = var_Items.AddItem("Root 1")
	g1 = var_Items.InsertItem(r,null,"Group A")
	// var_Items.CellValue(var_Items.InsertItem(g1,null,"Item 1"),1) = 1
	with (oG2antt)
		TemplateDef = [dim var_Items]
		TemplateDef = var_Items
		Template = [var_Items.CellValue(InsertItem(g1,,"Item 1"),1) = 1]
	endwith
	// var_Items.CellValue(var_Items.InsertItem(g1,null,"Item 2"),1) = 2
	with (oG2antt)
		TemplateDef = [dim var_Items]
		TemplateDef = var_Items
		Template = [var_Items.CellValue(InsertItem(g1,,"Item 2"),1) = 2]
	endwith
	// var_Items.CellState(var_Items.ItemByIndex(3),0) = 1
	with (oG2antt)
		TemplateDef = [dim var_Items]
		TemplateDef = var_Items
		Template = [var_Items.CellState(ItemByIndex(3),0) = 1]
	endwith
	g2 = var_Items.InsertItem(r,null,"Group B")
	// var_Items.CellValue(var_Items.InsertItem(g2,null,"Item 3"),1) = 3
	with (oG2antt)
		TemplateDef = [dim var_Items]
		TemplateDef = var_Items
		Template = [var_Items.CellValue(InsertItem(g2,,"Item 3"),1) = 3]
	endwith
	// var_Items.CellValue(var_Items.InsertItem(g2,null,"Item 4"),1) = 4
	with (oG2antt)
		TemplateDef = [dim var_Items]
		TemplateDef = var_Items
		Template = [var_Items.CellValue(InsertItem(g2,,"Item 4"),1) = 4]
	endwith
	// var_Items.ExpandItem(g1) = true
	with (oG2antt)
		TemplateDef = [dim var_Items,g1]
		TemplateDef = var_Items
		TemplateDef = g1
		Template = [var_Items.ExpandItem(g1) = True]
	endwith
	// var_Items.ExpandItem(r) = true
	with (oG2antt)
		TemplateDef = [dim var_Items,r]
		TemplateDef = var_Items
		TemplateDef = r
		Template = [var_Items.ExpandItem(r) = True]
	endwith
	h = var_Items.AddItem("divider")
	// var_Items.ItemDivider(h) = 0
	with (oG2antt)
		TemplateDef = [dim var_Items,h]
		TemplateDef = var_Items
		TemplateDef = h
		Template = [var_Items.ItemDivider(h) = 0]
	endwith
	// var_Items.SelectableItem(h) = false
	with (oG2antt)
		TemplateDef = [dim var_Items,h]
		TemplateDef = var_Items
		TemplateDef = h
		Template = [var_Items.SelectableItem(h) = False]
	endwith
	// var_Items.SortableItem(h) = false
	with (oG2antt)
		TemplateDef = [dim var_Items,h]
		TemplateDef = var_Items
		TemplateDef = h
		Template = [var_Items.SortableItem(h) = False]
	endwith
	// var_Items.ItemHeight(h) = 1
	with (oG2antt)
		TemplateDef = [dim var_Items,h]
		TemplateDef = var_Items
		TemplateDef = h
		Template = [var_Items.ItemHeight(h) = 1]
	endwith
	r = var_Items.AddItem("Root 2")
	g1 = var_Items.InsertItem(r,null,"Group C")
	// var_Items.CellValue(var_Items.InsertItem(g1,null,"Item 5"),1) = 5
	with (oG2antt)
		TemplateDef = [dim var_Items]
		TemplateDef = var_Items
		Template = [var_Items.CellValue(InsertItem(g1,,"Item 5"),1) = 5]
	endwith
	// var_Items.CellValue(var_Items.InsertItem(g1,null,"Item 6"),1) = 6
	with (oG2antt)
		TemplateDef = [dim var_Items]
		TemplateDef = var_Items
		Template = [var_Items.CellValue(InsertItem(g1,,"Item 6"),1) = 6]
	endwith
	// var_Items.SelectItem(var_Items.ItemByIndex(2)) = true
	with (oG2antt)
		TemplateDef = [dim var_Items]
		TemplateDef = var_Items
		Template = [var_Items.SelectItem(ItemByIndex(2)) = True]
	endwith
oG2antt.EndUpdate()
? Str(oG2antt.Export("","chk"))
|
|
2367
|
Export the selected-items

local g1,g2,h,oG2antt,r,var_Column,var_Column1,var_Columns,var_Items

oG2antt = form.EXG2ANTTCHARTACTIVEXCONTROL1.nativeObject
oG2antt.BeginUpdate()
oG2antt.HeaderAppearance = 4
oG2antt.ScrollBySingleLine = true
oG2antt.LinesAtRoot = 5
var_Columns = oG2antt.Columns
	var_Column = var_Columns.Add("Desc")
		var_Column.Width = 32
		// var_Column.Def(0) = true
		with (oG2antt)
			TemplateDef = [dim var_Column]
			TemplateDef = var_Column
			Template = [var_Column.Def(0) = True]
		endwith
	var_Column1 = var_Columns.Add("Amount")
		// var_Column1.Def(20) = "sum(current,rec,%1)"
		with (oG2antt)
			TemplateDef = [dim var_Column1]
			TemplateDef = var_Column1
			Template = [var_Column1.Def(20) = "sum(current,rec,%1)"]
		endwith
		var_Column1.FormatColumn = "currency(value)"
var_Items = oG2antt.Items
	// var_Items.LockedItemCount(0) = 1
	with (oG2antt)
		TemplateDef = [dim var_Items]
		TemplateDef = var_Items
		Template = [var_Items.LockedItemCount(0) = 1]
	endwith
	h = var_Items.LockedItem(0,0)
	// var_Items.CellValue(h,0) = "All"
	with (oG2antt)
		TemplateDef = [dim var_Items,h]
		TemplateDef = var_Items
		TemplateDef = h
		Template = [var_Items.CellValue(h,0) = "All"]
	endwith
	// var_Items.CellValue(h,1) = "sum(all,rec,%1)"
	with (oG2antt)
		TemplateDef = [dim var_Items,h]
		TemplateDef = var_Items
		TemplateDef = h
		Template = [var_Items.CellValue(h,1) = "sum(all,rec,%1)"]
	endwith
	// var_Items.CellValueFormat(h,1) = 4
	with (oG2antt)
		TemplateDef = [dim var_Items,h]
		TemplateDef = var_Items
		TemplateDef = h
		Template = [var_Items.CellValueFormat(h,1) = 4]
	endwith
	r = var_Items.AddItem("Root 1")
	g1 = var_Items.InsertItem(r,null,"Group A")
	// var_Items.CellValue(var_Items.InsertItem(g1,null,"Item 1"),1) = 1
	with (oG2antt)
		TemplateDef = [dim var_Items]
		TemplateDef = var_Items
		Template = [var_Items.CellValue(InsertItem(g1,,"Item 1"),1) = 1]
	endwith
	// var_Items.CellValue(var_Items.InsertItem(g1,null,"Item 2"),1) = 2
	with (oG2antt)
		TemplateDef = [dim var_Items]
		TemplateDef = var_Items
		Template = [var_Items.CellValue(InsertItem(g1,,"Item 2"),1) = 2]
	endwith
	// var_Items.CellState(var_Items.ItemByIndex(3),0) = 1
	with (oG2antt)
		TemplateDef = [dim var_Items]
		TemplateDef = var_Items
		Template = [var_Items.CellState(ItemByIndex(3),0) = 1]
	endwith
	g2 = var_Items.InsertItem(r,null,"Group B")
	// var_Items.CellValue(var_Items.InsertItem(g2,null,"Item 3"),1) = 3
	with (oG2antt)
		TemplateDef = [dim var_Items]
		TemplateDef = var_Items
		Template = [var_Items.CellValue(InsertItem(g2,,"Item 3"),1) = 3]
	endwith
	// var_Items.CellValue(var_Items.InsertItem(g2,null,"Item 4"),1) = 4
	with (oG2antt)
		TemplateDef = [dim var_Items]
		TemplateDef = var_Items
		Template = [var_Items.CellValue(InsertItem(g2,,"Item 4"),1) = 4]
	endwith
	// var_Items.ExpandItem(g1) = true
	with (oG2antt)
		TemplateDef = [dim var_Items,g1]
		TemplateDef = var_Items
		TemplateDef = g1
		Template = [var_Items.ExpandItem(g1) = True]
	endwith
	// var_Items.ExpandItem(r) = true
	with (oG2antt)
		TemplateDef = [dim var_Items,r]
		TemplateDef = var_Items
		TemplateDef = r
		Template = [var_Items.ExpandItem(r) = True]
	endwith
	h = var_Items.AddItem("divider")
	// var_Items.ItemDivider(h) = 0
	with (oG2antt)
		TemplateDef = [dim var_Items,h]
		TemplateDef = var_Items
		TemplateDef = h
		Template = [var_Items.ItemDivider(h) = 0]
	endwith
	// var_Items.SelectableItem(h) = false
	with (oG2antt)
		TemplateDef = [dim var_Items,h]
		TemplateDef = var_Items
		TemplateDef = h
		Template = [var_Items.SelectableItem(h) = False]
	endwith
	// var_Items.SortableItem(h) = false
	with (oG2antt)
		TemplateDef = [dim var_Items,h]
		TemplateDef = var_Items
		TemplateDef = h
		Template = [var_Items.SortableItem(h) = False]
	endwith
	// var_Items.ItemHeight(h) = 1
	with (oG2antt)
		TemplateDef = [dim var_Items,h]
		TemplateDef = var_Items
		TemplateDef = h
		Template = [var_Items.ItemHeight(h) = 1]
	endwith
	r = var_Items.AddItem("Root 2")
	g1 = var_Items.InsertItem(r,null,"Group C")
	// var_Items.CellValue(var_Items.InsertItem(g1,null,"Item 5"),1) = 5
	with (oG2antt)
		TemplateDef = [dim var_Items]
		TemplateDef = var_Items
		Template = [var_Items.CellValue(InsertItem(g1,,"Item 5"),1) = 5]
	endwith
	// var_Items.CellValue(var_Items.InsertItem(g1,null,"Item 6"),1) = 6
	with (oG2antt)
		TemplateDef = [dim var_Items]
		TemplateDef = var_Items
		Template = [var_Items.CellValue(InsertItem(g1,,"Item 6"),1) = 6]
	endwith
	// var_Items.SelectItem(var_Items.ItemByIndex(2)) = true
	with (oG2antt)
		TemplateDef = [dim var_Items]
		TemplateDef = var_Items
		Template = [var_Items.SelectItem(ItemByIndex(2)) = True]
	endwith
oG2antt.EndUpdate()
? Str(oG2antt.Export("","sel"))
|
|
2366
|
Export the visible items, excluding child items of collapsed elements, non-visible items (such as those with a height of 0), and items that do not match the current filter
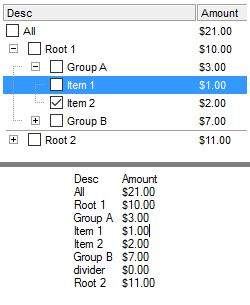
local g1,g2,h,oG2antt,r,var_Column,var_Column1,var_Columns,var_Items

oG2antt = form.EXG2ANTTCHARTACTIVEXCONTROL1.nativeObject
oG2antt.BeginUpdate()
oG2antt.HeaderAppearance = 4
oG2antt.ScrollBySingleLine = true
oG2antt.LinesAtRoot = 5
var_Columns = oG2antt.Columns
	var_Column = var_Columns.Add("Desc")
		var_Column.Width = 32
		// var_Column.Def(0) = true
		with (oG2antt)
			TemplateDef = [dim var_Column]
			TemplateDef = var_Column
			Template = [var_Column.Def(0) = True]
		endwith
	var_Column1 = var_Columns.Add("Amount")
		// var_Column1.Def(20) = "sum(current,rec,%1)"
		with (oG2antt)
			TemplateDef = [dim var_Column1]
			TemplateDef = var_Column1
			Template = [var_Column1.Def(20) = "sum(current,rec,%1)"]
		endwith
		var_Column1.FormatColumn = "currency(value)"
var_Items = oG2antt.Items
	// var_Items.LockedItemCount(0) = 1
	with (oG2antt)
		TemplateDef = [dim var_Items]
		TemplateDef = var_Items
		Template = [var_Items.LockedItemCount(0) = 1]
	endwith
	h = var_Items.LockedItem(0,0)
	// var_Items.CellValue(h,0) = "All"
	with (oG2antt)
		TemplateDef = [dim var_Items,h]
		TemplateDef = var_Items
		TemplateDef = h
		Template = [var_Items.CellValue(h,0) = "All"]
	endwith
	// var_Items.CellValue(h,1) = "sum(all,rec,%1)"
	with (oG2antt)
		TemplateDef = [dim var_Items,h]
		TemplateDef = var_Items
		TemplateDef = h
		Template = [var_Items.CellValue(h,1) = "sum(all,rec,%1)"]
	endwith
	// var_Items.CellValueFormat(h,1) = 4
	with (oG2antt)
		TemplateDef = [dim var_Items,h]
		TemplateDef = var_Items
		TemplateDef = h
		Template = [var_Items.CellValueFormat(h,1) = 4]
	endwith
	r = var_Items.AddItem("Root 1")
	g1 = var_Items.InsertItem(r,null,"Group A")
	// var_Items.CellValue(var_Items.InsertItem(g1,null,"Item 1"),1) = 1
	with (oG2antt)
		TemplateDef = [dim var_Items]
		TemplateDef = var_Items
		Template = [var_Items.CellValue(InsertItem(g1,,"Item 1"),1) = 1]
	endwith
	// var_Items.CellValue(var_Items.InsertItem(g1,null,"Item 2"),1) = 2
	with (oG2antt)
		TemplateDef = [dim var_Items]
		TemplateDef = var_Items
		Template = [var_Items.CellValue(InsertItem(g1,,"Item 2"),1) = 2]
	endwith
	// var_Items.CellState(var_Items.ItemByIndex(3),0) = 1
	with (oG2antt)
		TemplateDef = [dim var_Items]
		TemplateDef = var_Items
		Template = [var_Items.CellState(ItemByIndex(3),0) = 1]
	endwith
	g2 = var_Items.InsertItem(r,null,"Group B")
	// var_Items.CellValue(var_Items.InsertItem(g2,null,"Item 3"),1) = 3
	with (oG2antt)
		TemplateDef = [dim var_Items]
		TemplateDef = var_Items
		Template = [var_Items.CellValue(InsertItem(g2,,"Item 3"),1) = 3]
	endwith
	// var_Items.CellValue(var_Items.InsertItem(g2,null,"Item 4"),1) = 4
	with (oG2antt)
		TemplateDef = [dim var_Items]
		TemplateDef = var_Items
		Template = [var_Items.CellValue(InsertItem(g2,,"Item 4"),1) = 4]
	endwith
	// var_Items.ExpandItem(g1) = true
	with (oG2antt)
		TemplateDef = [dim var_Items,g1]
		TemplateDef = var_Items
		TemplateDef = g1
		Template = [var_Items.ExpandItem(g1) = True]
	endwith
	// var_Items.ExpandItem(r) = true
	with (oG2antt)
		TemplateDef = [dim var_Items,r]
		TemplateDef = var_Items
		TemplateDef = r
		Template = [var_Items.ExpandItem(r) = True]
	endwith
	h = var_Items.AddItem("divider")
	// var_Items.ItemDivider(h) = 0
	with (oG2antt)
		TemplateDef = [dim var_Items,h]
		TemplateDef = var_Items
		TemplateDef = h
		Template = [var_Items.ItemDivider(h) = 0]
	endwith
	// var_Items.SelectableItem(h) = false
	with (oG2antt)
		TemplateDef = [dim var_Items,h]
		TemplateDef = var_Items
		TemplateDef = h
		Template = [var_Items.SelectableItem(h) = False]
	endwith
	// var_Items.SortableItem(h) = false
	with (oG2antt)
		TemplateDef = [dim var_Items,h]
		TemplateDef = var_Items
		TemplateDef = h
		Template = [var_Items.SortableItem(h) = False]
	endwith
	// var_Items.ItemHeight(h) = 1
	with (oG2antt)
		TemplateDef = [dim var_Items,h]
		TemplateDef = var_Items
		TemplateDef = h
		Template = [var_Items.ItemHeight(h) = 1]
	endwith
	r = var_Items.AddItem("Root 2")
	g1 = var_Items.InsertItem(r,null,"Group C")
	// var_Items.CellValue(var_Items.InsertItem(g1,null,"Item 5"),1) = 5
	with (oG2antt)
		TemplateDef = [dim var_Items]
		TemplateDef = var_Items
		Template = [var_Items.CellValue(InsertItem(g1,,"Item 5"),1) = 5]
	endwith
	// var_Items.CellValue(var_Items.InsertItem(g1,null,"Item 6"),1) = 6
	with (oG2antt)
		TemplateDef = [dim var_Items]
		TemplateDef = var_Items
		Template = [var_Items.CellValue(InsertItem(g1,,"Item 6"),1) = 6]
	endwith
	// var_Items.SelectItem(var_Items.ItemByIndex(2)) = true
	with (oG2antt)
		TemplateDef = [dim var_Items]
		TemplateDef = var_Items
		Template = [var_Items.SelectItem(ItemByIndex(2)) = True]
	endwith
oG2antt.EndUpdate()
? Str(oG2antt.Export("","vis"))
|
|
2365
|
Export all items, including the hidden or collapsed items
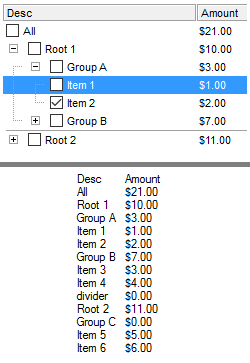
local g1,g2,h,oG2antt,r,var_Column,var_Column1,var_Columns,var_Items

oG2antt = form.EXG2ANTTCHARTACTIVEXCONTROL1.nativeObject
oG2antt.BeginUpdate()
oG2antt.HeaderAppearance = 4
oG2antt.ScrollBySingleLine = true
oG2antt.LinesAtRoot = 5
var_Columns = oG2antt.Columns
	var_Column = var_Columns.Add("Desc")
		var_Column.Width = 32
		// var_Column.Def(0) = true
		with (oG2antt)
			TemplateDef = [dim var_Column]
			TemplateDef = var_Column
			Template = [var_Column.Def(0) = True]
		endwith
	var_Column1 = var_Columns.Add("Amount")
		// var_Column1.Def(20) = "sum(current,rec,%1)"
		with (oG2antt)
			TemplateDef = [dim var_Column1]
			TemplateDef = var_Column1
			Template = [var_Column1.Def(20) = "sum(current,rec,%1)"]
		endwith
		var_Column1.FormatColumn = "currency(value)"
var_Items = oG2antt.Items
	// var_Items.LockedItemCount(0) = 1
	with (oG2antt)
		TemplateDef = [dim var_Items]
		TemplateDef = var_Items
		Template = [var_Items.LockedItemCount(0) = 1]
	endwith
	h = var_Items.LockedItem(0,0)
	// var_Items.CellValue(h,0) = "All"
	with (oG2antt)
		TemplateDef = [dim var_Items,h]
		TemplateDef = var_Items
		TemplateDef = h
		Template = [var_Items.CellValue(h,0) = "All"]
	endwith
	// var_Items.CellValue(h,1) = "sum(all,rec,%1)"
	with (oG2antt)
		TemplateDef = [dim var_Items,h]
		TemplateDef = var_Items
		TemplateDef = h
		Template = [var_Items.CellValue(h,1) = "sum(all,rec,%1)"]
	endwith
	// var_Items.CellValueFormat(h,1) = 4
	with (oG2antt)
		TemplateDef = [dim var_Items,h]
		TemplateDef = var_Items
		TemplateDef = h
		Template = [var_Items.CellValueFormat(h,1) = 4]
	endwith
	r = var_Items.AddItem("Root 1")
	g1 = var_Items.InsertItem(r,null,"Group A")
	// var_Items.CellValue(var_Items.InsertItem(g1,null,"Item 1"),1) = 1
	with (oG2antt)
		TemplateDef = [dim var_Items]
		TemplateDef = var_Items
		Template = [var_Items.CellValue(InsertItem(g1,,"Item 1"),1) = 1]
	endwith
	// var_Items.CellValue(var_Items.InsertItem(g1,null,"Item 2"),1) = 2
	with (oG2antt)
		TemplateDef = [dim var_Items]
		TemplateDef = var_Items
		Template = [var_Items.CellValue(InsertItem(g1,,"Item 2"),1) = 2]
	endwith
	// var_Items.CellState(var_Items.ItemByIndex(3),0) = 1
	with (oG2antt)
		TemplateDef = [dim var_Items]
		TemplateDef = var_Items
		Template = [var_Items.CellState(ItemByIndex(3),0) = 1]
	endwith
	g2 = var_Items.InsertItem(r,null,"Group B")
	// var_Items.CellValue(var_Items.InsertItem(g2,null,"Item 3"),1) = 3
	with (oG2antt)
		TemplateDef = [dim var_Items]
		TemplateDef = var_Items
		Template = [var_Items.CellValue(InsertItem(g2,,"Item 3"),1) = 3]
	endwith
	// var_Items.CellValue(var_Items.InsertItem(g2,null,"Item 4"),1) = 4
	with (oG2antt)
		TemplateDef = [dim var_Items]
		TemplateDef = var_Items
		Template = [var_Items.CellValue(InsertItem(g2,,"Item 4"),1) = 4]
	endwith
	// var_Items.ExpandItem(g1) = true
	with (oG2antt)
		TemplateDef = [dim var_Items,g1]
		TemplateDef = var_Items
		TemplateDef = g1
		Template = [var_Items.ExpandItem(g1) = True]
	endwith
	// var_Items.ExpandItem(r) = true
	with (oG2antt)
		TemplateDef = [dim var_Items,r]
		TemplateDef = var_Items
		TemplateDef = r
		Template = [var_Items.ExpandItem(r) = True]
	endwith
	h = var_Items.AddItem("divider")
	// var_Items.ItemDivider(h) = 0
	with (oG2antt)
		TemplateDef = [dim var_Items,h]
		TemplateDef = var_Items
		TemplateDef = h
		Template = [var_Items.ItemDivider(h) = 0]
	endwith
	// var_Items.SelectableItem(h) = false
	with (oG2antt)
		TemplateDef = [dim var_Items,h]
		TemplateDef = var_Items
		TemplateDef = h
		Template = [var_Items.SelectableItem(h) = False]
	endwith
	// var_Items.SortableItem(h) = false
	with (oG2antt)
		TemplateDef = [dim var_Items,h]
		TemplateDef = var_Items
		TemplateDef = h
		Template = [var_Items.SortableItem(h) = False]
	endwith
	// var_Items.ItemHeight(h) = 1
	with (oG2antt)
		TemplateDef = [dim var_Items,h]
		TemplateDef = var_Items
		TemplateDef = h
		Template = [var_Items.ItemHeight(h) = 1]
	endwith
	r = var_Items.AddItem("Root 2")
	g1 = var_Items.InsertItem(r,null,"Group C")
	// var_Items.CellValue(var_Items.InsertItem(g1,null,"Item 5"),1) = 5
	with (oG2antt)
		TemplateDef = [dim var_Items]
		TemplateDef = var_Items
		Template = [var_Items.CellValue(InsertItem(g1,,"Item 5"),1) = 5]
	endwith
	// var_Items.CellValue(var_Items.InsertItem(g1,null,"Item 6"),1) = 6
	with (oG2antt)
		TemplateDef = [dim var_Items]
		TemplateDef = var_Items
		Template = [var_Items.CellValue(InsertItem(g1,,"Item 6"),1) = 6]
	endwith
	// var_Items.SelectItem(var_Items.ItemByIndex(2)) = true
	with (oG2antt)
		TemplateDef = [dim var_Items]
		TemplateDef = var_Items
		Template = [var_Items.SelectItem(ItemByIndex(2)) = True]
	endwith
oG2antt.EndUpdate()
? Str(oG2antt.Export("","all"))
|
|
2364
|
Bolds only the expanded items
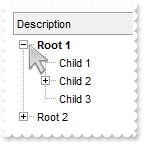
local h,oG2antt,var_ConditionalFormat,var_Items

oG2antt = form.EXG2ANTTCHARTACTIVEXCONTROL1.nativeObject
oG2antt.BeginUpdate()
oG2antt.HeaderAppearance = 4
oG2antt.HeaderHeight = 24
oG2antt.LinesAtRoot = -1
// oG2antt.ConditionalFormats.Add("%CX0").Bold = true
var_ConditionalFormat = oG2antt.ConditionalFormats.Add("%CX0")
with (oG2antt)
	TemplateDef = [dim var_ConditionalFormat]
	TemplateDef = var_ConditionalFormat
	Template = [var_ConditionalFormat.Bold = True]
endwith
oG2antt.Columns.Add("Description")
var_Items = oG2antt.Items
	h = var_Items.AddItem("Root 1")
	var_Items.InsertItem(h,null,"Child 1")
	var_Items.InsertItem(var_Items.InsertItem(h,null,"Child 2"),null,"Sub-Child 2")
	// var_Items.CellState(var_Items.InsertItem(h,null,"Child 3"),0) = 1
	with (oG2antt)
		TemplateDef = [dim var_Items]
		TemplateDef = var_Items
		Template = [var_Items.CellState(InsertItem(h,,"Child 3"),0) = 1]
	endwith
	// var_Items.ExpandItem(h) = true
	with (oG2antt)
		TemplateDef = [dim var_Items,h]
		TemplateDef = var_Items
		TemplateDef = h
		Template = [var_Items.ExpandItem(h) = True]
	endwith
	h = var_Items.AddItem("Root 2")
	var_Items.InsertItem(h,null,"Child 1")
	var_Items.InsertItem(h,null,"Child 2")
	var_Items.InsertItem(h,null,"Child 3")
oG2antt.EndUpdate()
|
|
2363
|
Displays the root item's index and value/caption using expressions
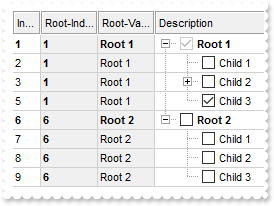
local h,oG2antt,var_Column,var_Column1,var_Column2,var_Column3,var_ConditionalFormat,var_ConditionalFormat1,var_Items

oG2antt = form.EXG2ANTTCHARTACTIVEXCONTROL1.nativeObject
oG2antt.BeginUpdate()
oG2antt.HeaderAppearance = 4
oG2antt.HeaderHeight = 24
oG2antt.LinesAtRoot = -1
oG2antt.AutoDrag = 3
oG2antt.AllowCopyPaste = 7 /*exAllowPaste | exAllowCut | exAllowCopy*/
oG2antt.SingleSel = false
oG2antt.DrawGridLines = -2
oG2antt.GridLineStyle = 48
oG2antt.GridLineColor = 0xd0d0d0
// oG2antt.ConditionalFormats.Add("%CC0 and %CX0").Bold = true
var_ConditionalFormat = oG2antt.ConditionalFormats.Add("%CC0 and %CX0")
with (oG2antt)
	TemplateDef = [dim var_ConditionalFormat]
	TemplateDef = var_ConditionalFormat
	Template = [var_ConditionalFormat.Bold = True]
endwith
var_ConditionalFormat1 = oG2antt.ConditionalFormats.Add("1")
	var_ConditionalFormat1.Bold = true
	var_ConditionalFormat1.ApplyTo = 2 /*0x2 | */
var_Column = oG2antt.Columns.Add("Description")
	// var_Column.Def(0) = true
	with (oG2antt)
		TemplateDef = [dim var_Column]
		TemplateDef = var_Column
		Template = [var_Column.Def(0) = True]
	endwith
	var_Column.PartialCheck = true
var_Column1 = oG2antt.Columns.Add("Index")
	var_Column1.FormatColumn = "1 index ``"
	var_Column1.Position = 0
	var_Column1.Width = 16
var_Column2 = oG2antt.Columns.Add("Root-Index")
	var_Column2.FormatColumn = "root(1 index ``)"
	var_Column2.Position = 1
	var_Column2.Width = 32
	// var_Column2.Def(4) = 15790320
	with (oG2antt)
		TemplateDef = [dim var_Column2]
		TemplateDef = var_Column2
		Template = [var_Column2.Def(4) = 15790320]
	endwith
var_Column3 = oG2antt.Columns.Add("Root-Value")
	var_Column3.FormatColumn = "root(%0)"
	var_Column3.Position = 2
	var_Column3.Width = 32
	// var_Column3.Def(4) = 15790320
	with (oG2antt)
		TemplateDef = [dim var_Column3]
		TemplateDef = var_Column3
		Template = [var_Column3.Def(4) = 15790320]
	endwith
var_Items = oG2antt.Items
	h = var_Items.AddItem("Root 1")
	var_Items.InsertItem(h,null,"Child 1")
	var_Items.InsertItem(var_Items.InsertItem(h,null,"Child 2"),null,"Sub-Child 2")
	// var_Items.CellState(var_Items.InsertItem(h,null,"Child 3"),0) = 1
	with (oG2antt)
		TemplateDef = [dim var_Items]
		TemplateDef = var_Items
		Template = [var_Items.CellState(InsertItem(h,,"Child 3"),0) = 1]
	endwith
	// var_Items.ExpandItem(h) = true
	with (oG2antt)
		TemplateDef = [dim var_Items,h]
		TemplateDef = var_Items
		TemplateDef = h
		Template = [var_Items.ExpandItem(h) = True]
	endwith
	h = var_Items.AddItem("Root 2")
	var_Items.InsertItem(h,null,"Child 1")
	var_Items.InsertItem(h,null,"Child 2")
	var_Items.InsertItem(h,null,"Child 3")
	// var_Items.ExpandItem(h) = true
	with (oG2antt)
		TemplateDef = [dim var_Items,h]
		TemplateDef = var_Items
		TemplateDef = h
		Template = [var_Items.ExpandItem(h) = True]
	endwith
oG2antt.EndUpdate()
|
|
2362
|
Displays the parent item's index and caption/value using expressions
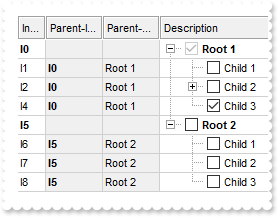
local h,oG2antt,var_Column,var_Column1,var_Column2,var_Column3,var_ConditionalFormat,var_ConditionalFormat1,var_Items

oG2antt = form.EXG2ANTTCHARTACTIVEXCONTROL1.nativeObject
oG2antt.BeginUpdate()
oG2antt.HeaderAppearance = 4
oG2antt.HeaderHeight = 24
oG2antt.LinesAtRoot = -1
oG2antt.AutoDrag = 3
oG2antt.AllowCopyPaste = 7 /*exAllowPaste | exAllowCut | exAllowCopy*/
oG2antt.SingleSel = false
oG2antt.DrawGridLines = -2
oG2antt.GridLineStyle = 48
oG2antt.GridLineColor = 0xd0d0d0
// oG2antt.ConditionalFormats.Add("%CC0 and %CX0").Bold = true
var_ConditionalFormat = oG2antt.ConditionalFormats.Add("%CC0 and %CX0")
with (oG2antt)
	TemplateDef = [dim var_ConditionalFormat]
	TemplateDef = var_ConditionalFormat
	Template = [var_ConditionalFormat.Bold = True]
endwith
var_ConditionalFormat1 = oG2antt.ConditionalFormats.Add("1")
	var_ConditionalFormat1.Bold = true
	var_ConditionalFormat1.ApplyTo = 2 /*0x2 | */
var_Column = oG2antt.Columns.Add("Description")
	// var_Column.Def(0) = true
	with (oG2antt)
		TemplateDef = [dim var_Column]
		TemplateDef = var_Column
		Template = [var_Column.Def(0) = True]
	endwith
	var_Column.PartialCheck = true
var_Column1 = oG2antt.Columns.Add("Index")
	var_Column1.FormatColumn = "1 index `I`"
	var_Column1.Position = 0
	var_Column1.Width = 16
var_Column2 = oG2antt.Columns.Add("Parent-Index")
	var_Column2.FormatColumn = "parent(1 index `I`)"
	var_Column2.Position = 1
	var_Column2.Width = 32
	// var_Column2.Def(4) = 15790320
	with (oG2antt)
		TemplateDef = [dim var_Column2]
		TemplateDef = var_Column2
		Template = [var_Column2.Def(4) = 15790320]
	endwith
var_Column3 = oG2antt.Columns.Add("Parent-Value")
	var_Column3.FormatColumn = "parent(%0)"
	var_Column3.Position = 2
	var_Column3.Width = 32
	// var_Column3.Def(4) = 15790320
	with (oG2antt)
		TemplateDef = [dim var_Column3]
		TemplateDef = var_Column3
		Template = [var_Column3.Def(4) = 15790320]
	endwith
var_Items = oG2antt.Items
	h = var_Items.AddItem("Root 1")
	var_Items.InsertItem(h,null,"Child 1")
	var_Items.InsertItem(var_Items.InsertItem(h,null,"Child 2"),null,"Sub-Child 2")
	// var_Items.CellState(var_Items.InsertItem(h,null,"Child 3"),0) = 1
	with (oG2antt)
		TemplateDef = [dim var_Items]
		TemplateDef = var_Items
		Template = [var_Items.CellState(InsertItem(h,,"Child 3"),0) = 1]
	endwith
	// var_Items.ExpandItem(h) = true
	with (oG2antt)
		TemplateDef = [dim var_Items,h]
		TemplateDef = var_Items
		TemplateDef = h
		Template = [var_Items.ExpandItem(h) = True]
	endwith
	h = var_Items.AddItem("Root 2")
	var_Items.InsertItem(h,null,"Child 1")
	var_Items.InsertItem(h,null,"Child 2")
	var_Items.InsertItem(h,null,"Child 3")
	// var_Items.ExpandItem(h) = true
	with (oG2antt)
		TemplateDef = [dim var_Items,h]
		TemplateDef = var_Items
		TemplateDef = h
		Template = [var_Items.ExpandItem(h) = True]
	endwith
oG2antt.EndUpdate()
|
|
2361
|
Copying and Pasting the Selection Programmatically
local h,oG2antt,var_Chart,var_Items

oG2antt = form.EXG2ANTTCHARTACTIVEXCONTROL1.nativeObject
oG2antt.BeginUpdate()
oG2antt.Columns.Add("Tasks")
oG2antt.LinesAtRoot = -1
var_Chart = oG2antt.Chart
	var_Chart.LevelCount = 2
	var_Chart.FirstVisibleDate = "01/01/2025"
	// var_Chart.PaneWidth(false) = 128
	with (oG2antt)
		TemplateDef = [dim var_Chart]
		TemplateDef = var_Chart
		Template = [var_Chart.PaneWidth(False) = 128]
	endwith
	var_Chart.SelBackColor = oG2antt.SelBackColor
	var_Chart.Bars.Item("Task").OverlaidType = 4
oG2antt.SingleSel = false
var_Items = oG2antt.Items
	var_Items.AddItem("Tasks")
	h = var_Items.AddItem("Task 1")
	var_Items.AddBar(h,"Task","01/02/2025","01/08/2025","T1")
	var_Items.AddBar(h,"Task","01/07/2025","01/13/2025","T2")
	// var_Items.SelectItem(h) = true
	with (oG2antt)
		TemplateDef = [dim var_Items,h]
		TemplateDef = var_Items
		TemplateDef = h
		Template = [var_Items.SelectItem(h) = True]
	endwith
	h = var_Items.AddItem("Task 2")
	var_Items.AddBar(h,"Task","01/02/2025","01/08/2025","T1")
	var_Items.AddBar(h,"Task","01/07/2025","01/13/2025","T2")
	// var_Items.SelectItem(h) = true
	with (oG2antt)
		TemplateDef = [dim var_Items,h]
		TemplateDef = var_Items
		TemplateDef = h
		Template = [var_Items.SelectItem(h) = True]
	endwith
oG2antt.IndentSelection(false)
oG2antt.CopySelection()
oG2antt.Items.UnselectAll()
oG2antt.Paste()
oG2antt.EndUpdate()
|
|
2360
|
Enable Copy, Cut and Paste Clipboard operations
local h,oG2antt,var_Chart,var_ConditionalFormat,var_Items

oG2antt = form.EXG2ANTTCHARTACTIVEXCONTROL1.nativeObject
oG2antt.BeginUpdate()
oG2antt.Columns.Add("Tasks")
oG2antt.LinesAtRoot = -1
oG2antt.AllowCopyPaste = 7 /*exAllowPaste | exAllowCut | exAllowCopy*/
// oG2antt.ConditionalFormats.Add("%CC0 and %CX0").Bold = true
var_ConditionalFormat = oG2antt.ConditionalFormats.Add("%CC0 and %CX0")
with (oG2antt)
	TemplateDef = [dim var_ConditionalFormat]
	TemplateDef = var_ConditionalFormat
	Template = [var_ConditionalFormat.Bold = True]
endwith
oG2antt.ConditionalFormats.Add("1")
var_Chart = oG2antt.Chart
	var_Chart.LevelCount = 2
	var_Chart.FirstVisibleDate = "01/01/2025"
	// var_Chart.PaneWidth(false) = 128
	with (oG2antt)
		TemplateDef = [dim var_Chart]
		TemplateDef = var_Chart
		Template = [var_Chart.PaneWidth(False) = 128]
	endwith
	var_Chart.SelBackColor = oG2antt.SelBackColor
	var_Chart.Bars.Item("Task").OverlaidType = 4
oG2antt.SingleSel = false
var_Items = oG2antt.Items
	var_Items.AddItem("Tasks")
	h = var_Items.AddItem("Task 1")
	var_Items.AddBar(h,"Task","01/02/2025","01/08/2025","T1")
	var_Items.AddBar(h,"Task","01/07/2025","01/13/2025","T2")
	// var_Items.SelectItem(h) = true
	with (oG2antt)
		TemplateDef = [dim var_Items,h]
		TemplateDef = var_Items
		TemplateDef = h
		Template = [var_Items.SelectItem(h) = True]
	endwith
	h = var_Items.AddItem("Task 2")
	var_Items.AddBar(h,"Task","01/02/2025","01/08/2025","T1")
	var_Items.AddBar(h,"Task","01/07/2025","01/13/2025","T2")
	// var_Items.SelectItem(h) = true
	with (oG2antt)
		TemplateDef = [dim var_Items,h]
		TemplateDef = var_Items
		TemplateDef = h
		Template = [var_Items.SelectItem(h) = True]
	endwith
oG2antt.IndentSelection(false)
oG2antt.EndUpdate()
|
|
2359
|
Adjusts the hierarchy of selected items by changing their parent
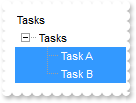
local oG2antt,var_Items

oG2antt = form.EXG2ANTTCHARTACTIVEXCONTROL1.nativeObject
oG2antt.BeginUpdate()
oG2antt.Columns.Add("Tasks")
oG2antt.LinesAtRoot = -1
oG2antt.SingleSel = false
var_Items = oG2antt.Items
	var_Items.AddItem("Tasks")
	// var_Items.SelectItem(var_Items.AddItem("Task A")) = true
	with (oG2antt)
		TemplateDef = [dim var_Items]
		TemplateDef = var_Items
		Template = [var_Items.SelectItem(AddItem("Task A")) = True]
	endwith
	// var_Items.SelectItem(var_Items.AddItem("Task B")) = true
	with (oG2antt)
		TemplateDef = [dim var_Items]
		TemplateDef = var_Items
		Template = [var_Items.SelectItem(AddItem("Task B")) = True]
	endwith
oG2antt.IndentSelection(false)
oG2antt.EndUpdate()
|
|
2358
|
How can I change the visual appearance for selected bars (EBN, frame, dash, enlarged)
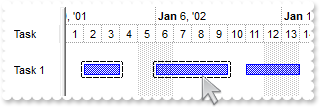
local h,oG2antt,var_Appearance,var_Chart,var_Items

oG2antt = form.EXG2ANTTCHARTACTIVEXCONTROL1.nativeObject
oG2antt.BeginUpdate()
var_Appearance = oG2antt.VisualAppearance
	var_Appearance.Add(2,"gBFLBCJwBAEHhEJAAEhABMcGACAADACAxRDAMgBQKAAzQFAYahqGKGAAGOD4JhUAIIRZGMIjFDcEwxC6NIpAWCYRDEMw4AJCI4DRCIZBuGyPRhASQZUhmHIDTbIEBxfIMIxLE6YaBjObIaoSGYfUhCMowG79GgBJp/YqncaKCgSHwyUrNEbgRDQEw9L6BaxqCj6OhWLQ1CTZdowSKoYTXBq3IhkGiYZpyO5gABYVLWHY0ExNFCVJYjOT5RiONaHABOM43JKkfT9IC/KpxGhoWxSdo6ABXVz2DBNRz5EjHaoyHQ5Ypmc4JZbleZZTbFdSjT6BbS2KzLRzSb5aXhqMI6XD+XTJKK+YIkeqZLjGJaEYblGKZPruOz3MrQOCwCAfBafZHBsaYojqmovhkSpnGuegbBiXYjGccJblsdpxFqTgyjeW5Nl4fAbnyLpmBIUA0hiToHFOmBjFcRgECENQHEYQxkCQKBumCBZcBgRYPkYIQaGwERoEEFRsBUCBWBaBZhCafgYgaYYYHIHh4iGeIGBWBJiCgYgPgkYR4h4KIIl8JIGBkUwUmOLRyECUAQIC")
	var_Appearance.Add(1,"CP:2 -2 -2 2 2")
var_Chart = oG2antt.Chart
	var_Chart.LevelCount = 2
	var_Chart.FirstVisibleDate = "01/01/2002"
	var_Chart.SelBarColor = 0x1000000
	// var_Chart.PaneWidth(false) = 48
	with (oG2antt)
		TemplateDef = [dim var_Chart]
		TemplateDef = var_Chart
		Template = [var_Chart.PaneWidth(0) = 48]
	endwith
oG2antt.Columns.Add("Task")
var_Items = oG2antt.Items
	var_Items.AddItem()
	h = var_Items.AddItem("Task 1")
	var_Items.AddBar(h,"Task","01/02/2002","01/04/2002","A")
	var_Items.AddBar(h,"Task","01/06/2002","01/10/2002","B")
	var_Items.AddBar(h,"Task","01/11/2002","01/14/2002","C")
	// var_Items.ItemBar(h,"A",257) = true
	with (oG2antt)
		TemplateDef = [dim var_Items,h]
		TemplateDef = var_Items
		TemplateDef = h
		Template = [var_Items.ItemBar(h,"A",257) = True]
	endwith
	// var_Items.ItemBar(h,"B",257) = true
	with (oG2antt)
		TemplateDef = [dim var_Items,h]
		TemplateDef = var_Items
		TemplateDef = h
		Template = [var_Items.ItemBar(h,"B",257) = True]
	endwith
	var_Items.AddItem()
oG2antt.EndUpdate()
|
|
2357
|
Specify the size of the Columns panel

local oG2antt,var_Column,var_Column1,var_Columns

oG2antt = form.EXG2ANTTCHARTACTIVEXCONTROL1.nativeObject
oG2antt.BeginUpdate()
oG2antt.HeaderHeight = 24
oG2antt.HeaderAppearance = 4
var_Columns = oG2antt.Columns
	var_Columns.Add("City")
	// var_Columns.Add("Start").Visible = false
	var_Column = var_Columns.Add("Start")
	with (oG2antt)
		TemplateDef = [dim var_Column]
		TemplateDef = var_Column
		Template = [var_Column.Visible = False]
	endwith
	// var_Columns.Add("End").Visible = false
	var_Column1 = var_Columns.Add("End")
	with (oG2antt)
		TemplateDef = [dim var_Column1]
		TemplateDef = var_Column1
		Template = [var_Column1.Visible = False]
	endwith
oG2antt.ColumnsFloatBarRect = ",,96"
oG2antt.ColumnsFloatBarVisible = 34 /*exColumnsFloatBarVisibleAsChild | exColumnsFloatBarVisibleIncludeCheckColumns*/
oG2antt.EndUpdate()
|
|
2356
|
Show a vertical line between pivot and Columns panel (EBN color)
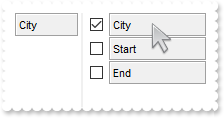
local oG2antt,var_Column,var_Column1,var_Columns

oG2antt = form.EXG2ANTTCHARTACTIVEXCONTROL1.nativeObject
oG2antt.BeginUpdate()
oG2antt.VisualAppearance.Add(1,"gBFLBCJwBAEHhEJAAEhABRsIQAAYAQGKIYBkAKBQAGaAoDDUNQxQwAAxwfBMKgBBCLIxhEYobgmGIXRpFICQTIcBhaGIZRiAKCRTDmHwyRCNIwCLD8QxtDqBY4gOZZXhal4cJTgMaBYi+Pw3DZHcbvBRkewzHQAKgnSjoDhEMg1CTVVYTDKdOSzDyEX7sIAACpOIZQVJVEY1VT8cyxIyEZimSypWqiYJ0Ty6cQwTAIgI")
oG2antt.Template = [Background(87) = 16777216] // oG2antt.Background(87) = 0x1000000
oG2antt.HeaderHeight = 24
oG2antt.HeaderAppearance = 4
var_Columns = oG2antt.Columns
	var_Columns.Add("City")
	// var_Columns.Add("Start").Visible = false
	var_Column = var_Columns.Add("Start")
	with (oG2antt)
		TemplateDef = [dim var_Column]
		TemplateDef = var_Column
		Template = [var_Column.Visible = False]
	endwith
	// var_Columns.Add("End").Visible = false
	var_Column1 = var_Columns.Add("End")
	with (oG2antt)
		TemplateDef = [dim var_Column1]
		TemplateDef = var_Column1
		Template = [var_Column1.Visible = False]
	endwith
oG2antt.ColumnsFloatBarVisible = 34 /*exColumnsFloatBarVisibleAsChild | exColumnsFloatBarVisibleIncludeCheckColumns*/
oG2antt.EndUpdate()
|
|
2355
|
Change the background of the Columns panel (EBN color)
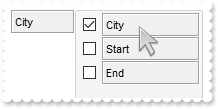
local oG2antt,var_Column,var_Column1,var_Columns

oG2antt = form.EXG2ANTTCHARTACTIVEXCONTROL1.nativeObject
oG2antt.BeginUpdate()
oG2antt.VisualAppearance.Add(1,"gBFLBCJwBAEHhEJAAEhABNoCg6AADACAxRDAMgBQKAAzQFAYahqGKGAAGOD4JhUAIIRZGMIjFDcEwxC6NIpAWLoJDCH4mSTHYxgJIMWwzDiBZgkCA4fiGEYnThCIxzTJ0aw1CKbYRAKCUKoUAJFsSnQAJIgOO4lULPMIhDDQKQTIKBahoehqIhaEQyDSJNb2DCIahhMSEbKtCooDhGFZUWzLVxTJJNawHJqJJDuOTpSjKH4+RjWFKUXR9b4BJSNAgqeCQTiSWZEVxRUS0XbGCyZLSQY7uAAMKgOVoDYzdGLwHTtOwrMa1QAsDSbKqWZ5uRpHcQ5aAGN5DPbMbqwOaqLznAaLQLtG4RTikVRPTDYaj437+OaHGyNbI6HTNPpTlWDJWjYXI8l8C4fg6GYAAEEISgGJJGHQOocgyIwYnqKhYAAIQTH2MYRjQJBRAmZptmEAYIjGU5dk8UgOFgBJUgCTQIBYBoBmCCAmAqApghgDJUDmYQFCCZoEk2OBUm+BZPCgZgagaYZIHYHoHmGWBcm8NwiEiFJVgmYgji4Kg6GKSI2C6C5jAiRgygwIojiycINkyeJmAYPJjkiTg+g+ZAIkCdIQkyWQWDuDxkBkJhKguZAzlIRQzGQc5ODWFJlEkVhWhWZYJFYTYTmUE4yF6F5mAmBhihiZhJhYX4WmQaAUnWGpOlmNhuhuZwJkYcocmcSY4naHZlkmKhrDuJ5JnYfofmgCgGgKIJnlmXJ2h4TQKBosRokoNoOiOaQKDSd" ;
	 +"4kmiChMncPBpgoZoaiaaZKHaHonmmE5iiKJRpDicomimaoKiaKoqmqSoeiIPgogqPotiyaxKlYPA+GuCqbBMa5KnaPovmwCwGj6LgP24RIhiyCwmkqMpsksNpKD6LQLBqOIzi0SxWlaHZtAOahPssM5Wi+IYtlsXpijKbZ5lyTo5mAE4UlqOpjHOQpEjubyanKPJvEuNgVj2TY1CCao+k2G52AyP5wAwBp9DYZZ1CCaxsAABAEICA")
oG2antt.Template = [Background(87) = 16777216] // oG2antt.Background(87) = 0x1000000
oG2antt.HeaderHeight = 24
oG2antt.HeaderAppearance = 4
var_Columns = oG2antt.Columns
	var_Columns.Add("City")
	// var_Columns.Add("Start").Visible = false
	var_Column = var_Columns.Add("Start")
	with (oG2antt)
		TemplateDef = [dim var_Column]
		TemplateDef = var_Column
		Template = [var_Column.Visible = False]
	endwith
	// var_Columns.Add("End").Visible = false
	var_Column1 = var_Columns.Add("End")
	with (oG2antt)
		TemplateDef = [dim var_Column1]
		TemplateDef = var_Column1
		Template = [var_Column1.Visible = False]
	endwith
oG2antt.ColumnsFloatBarVisible = 34 /*exColumnsFloatBarVisibleAsChild | exColumnsFloatBarVisibleIncludeCheckColumns*/
oG2antt.EndUpdate()
|
|
2354
|
Change the background of the Columns panel (solid color)
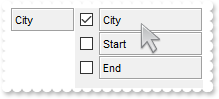
local oG2antt,var_Column,var_Column1,var_Columns

oG2antt = form.EXG2ANTTCHARTACTIVEXCONTROL1.nativeObject
oG2antt.BeginUpdate()
oG2antt.HeaderHeight = 24
oG2antt.HeaderAppearance = 4
var_Columns = oG2antt.Columns
	var_Columns.Add("City")
	// var_Columns.Add("Start").Visible = false
	var_Column = var_Columns.Add("Start")
	with (oG2antt)
		TemplateDef = [dim var_Column]
		TemplateDef = var_Column
		Template = [var_Column.Visible = False]
	endwith
	// var_Columns.Add("End").Visible = false
	var_Column1 = var_Columns.Add("End")
	with (oG2antt)
		TemplateDef = [dim var_Column1]
		TemplateDef = var_Column1
		Template = [var_Column1.Visible = False]
	endwith
oG2antt.ColumnsFloatBarVisible = 34 /*exColumnsFloatBarVisibleAsChild | exColumnsFloatBarVisibleIncludeCheckColumns*/
oG2antt.Template = [Background(87) = 15790320] // oG2antt.Background(87) = 0xf0f0f0
oG2antt.EndUpdate()
|
|
2353
|
Change the visual appearance of the Columns panel
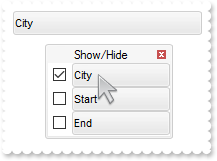
local oG2antt,var_Column,var_Column1,var_Columns

oG2antt = form.EXG2ANTTCHARTACTIVEXCONTROL1.nativeObject
oG2antt.BeginUpdate()
oG2antt.VisualAppearance.Add(1,"gBFLBCJwBAEHhEJAAEhABNoCg6AADACAxRDAMgBQKAAzQFAYahqGKGAAGOD4JhUAIIRZGMIjFDcEwxC6NIpAWLoJDCH4mSTHYxgJIMWwzDiBZgkCA4fiGEYnThCIxzTJ0aw1CKbYRAKCUKoUAJFsSnQAJIgOO4lULPMIhDDQKQTIKBahoehqIhaEQyDSJNb2DCIahhMSEbKtCooDhGFZUWzLVxTJJNawHJqJJDuOTpSjKH4+RjWFKUXR9b4BJSNAgqeCQTiSWZEVxRUS0XbGCyZLSQY7uAAMKgOVoDYzdGLwHTtOwrMa1QAsDSbKqWZ5uRpHcQ5aAGN5DPbMbqwOaqLznAaLQLtG4RTikVRPTDYaj437+OaHGyNbI6HTNPpTlWDJWjYXI8l8C4fg6GYAAEEISgGJJGHQOocgyIwYnqKhYAAIQTH2MYRjQJBRAmZptmEAYIjGU5dk8UgOFgBJUgCTQIBYBoBmCCAmAqApghgDJUDmYQFCCZoEk2OBUm+BZPCgZgagaYZIHYHoHmGWBcm8NwiEiFJVgmYgji4Kg6GKSI2C6C5jAiRgygwIojiycINkyeJmAYPJjkiTg+g+ZAIkCdIQkyWQWDuDxkBkJhKguZAzlIRQzGQc5ODWFJlEkVhWhWZYJFYTYTmUE4yF6F5mAmBhihiZhJhYX4WmQaAUnWGpOlmNhuhuZwJkYcocmcSY4naHZlkmKhrDuJ5JnYfofmgCgGgKIJnlmXJ2h4TQKBosRokoNoOiOaQKDSd" ;
	 +"4kmiChMncPBpgoZoaiaaZKHaHonmmE5iiKJRpDicomimaoKiaKoqmqSoeiIPgogqPotiyaxKlYPA+GuCqbBMa5KnaPovmwCwGj6LgP24RIhiyCwmkqMpsksNpKD6LQLBqOIzi0SxWlaHZtAOahPssM5Wi+IYtlsXpijKbZ5lyTo5mAE4UlqOpjHOQpEjubyanKPJvEuNgVj2TY1CCao+k2G52AyP5wAwBp9DYZZ1CCaxsAABAEICA")
oG2antt.Template = [Background(92) = 16777216] // oG2antt.Background(92) = 0x1000000
oG2antt.Template = [Background(93) = 16185078] // oG2antt.Background(93) = 0xf6f6f6
oG2antt.BackColorHeader = 0x1000000
oG2antt.HeaderHeight = 24
oG2antt.HeaderAppearance = 4
var_Columns = oG2antt.Columns
	var_Columns.Add("City")
	// var_Columns.Add("Start").Visible = false
	var_Column = var_Columns.Add("Start")
	with (oG2antt)
		TemplateDef = [dim var_Column]
		TemplateDef = var_Column
		Template = [var_Column.Visible = False]
	endwith
	// var_Columns.Add("End").Visible = false
	var_Column1 = var_Columns.Add("End")
	with (oG2antt)
		TemplateDef = [dim var_Column1]
		TemplateDef = var_Column1
		Template = [var_Column1.Visible = False]
	endwith
oG2antt.Template = [Description(26) = "Show/Hide"] // oG2antt.Description(26) = "Show/Hide"
oG2antt.ColumnsFloatBarVisible = 2
oG2antt.EndUpdate()
|
|
2352
|
Defines the symbol used to indicate repeated captions, providing a clear visual cue for identical entries (ditto mark)
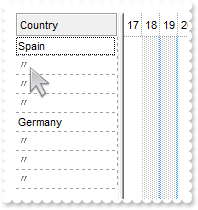
local oG2antt,var_Column,var_Items

oG2antt = form.EXG2ANTTCHARTACTIVEXCONTROL1.nativeObject
oG2antt.BeginUpdate()
oG2antt.HeaderAppearance = 4
oG2antt.HeaderHeight = 24
oG2antt.DrawGridLines = -2
// oG2antt.Columns.Add("Country").ShowIdem = "<fgcolor gray>〃"
var_Column = oG2antt.Columns.Add("Country")
with (oG2antt)
	TemplateDef = [dim var_Column]
	TemplateDef = var_Column
	Template = [var_Column.ShowIdem = "<fgcolor gray>〃"]
endwith
var_Items = oG2antt.Items
	var_Items.AddItem("Spain")
	var_Items.AddItem("Spain")
	var_Items.AddItem("Spain")
	var_Items.AddItem("Spain")
	var_Items.AddItem("Germany")
	var_Items.AddItem("Germany")
	var_Items.AddItem("Germany")
	var_Items.AddItem("Germany")
oG2antt.EndUpdate()
|
|
2351
|
Defines the symbol used to indicate repeated captions, providing a clear visual cue for identical entries (space)
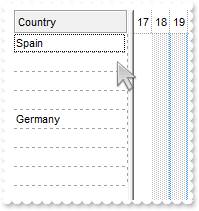
local oG2antt,var_Column,var_Items

oG2antt = form.EXG2ANTTCHARTACTIVEXCONTROL1.nativeObject
oG2antt.BeginUpdate()
oG2antt.HeaderAppearance = 4
oG2antt.HeaderHeight = 24
oG2antt.DrawGridLines = -2
// oG2antt.Columns.Add("Country").ShowIdem = " "
var_Column = oG2antt.Columns.Add("Country")
with (oG2antt)
	TemplateDef = [dim var_Column]
	TemplateDef = var_Column
	Template = [var_Column.ShowIdem = " "]
endwith
var_Items = oG2antt.Items
	var_Items.AddItem("Spain")
	var_Items.AddItem("Spain")
	var_Items.AddItem("Spain")
	var_Items.AddItem("Spain")
	var_Items.AddItem("Germany")
	var_Items.AddItem("Germany")
	var_Items.AddItem("Germany")
	var_Items.AddItem("Germany")
oG2antt.EndUpdate()
|
|
2350
|
Displays a glitch funnel for drop-down filter buttons (empty or active)
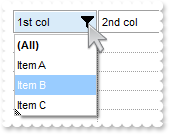
local oG2antt,var_Appearance,var_Column,var_Items

oG2antt = form.EXG2ANTTCHARTACTIVEXCONTROL1.nativeObject
oG2antt.BeginUpdate()
var_Appearance = oG2antt.VisualAppearance
	var_Appearance.RenderType = -1
	var_Appearance.Add(1,"gBFLBCJwBAEHhEJAAEhABa8IQAAYAQGKIYBkAKBQAGaAoDDUNQxQwAAxwfBMKgBBCLIxhEYobgmGIXRpFMbxCKQahLEiTIhGUYJHgmK4tRiAUgxVDkBxrECZYqjcBZOiwLQ2TxDM7DNKUCBnIoABhGOaYDh+IQNQjUFKwTRFGRxK4EIRKAyTDLQdRyGSMMbjdQpBCbMiMRqhESKRq2UwYRYCFS1NalaztO6BUAvK67YrWez/YBfF+SfwGeqDYReWAPfgWERnQrGMLxbD8KwZAKTRjkGJ4XhuB41TbQMqufL9ByXHKSSDpGjaXjeO5VVjYNAvS69UzXNq3bhtQAOXCMEwCgI=")
	var_Appearance.Add(2,"CP:1 -2 0 0 0")
oG2antt.DrawGridLines = -1
oG2antt.GridLineStyle = 512
oG2antt.ShowFocusRect = false
oG2antt.Template = [Background(0) = 33554432] // oG2antt.Background(0) = 0x2000000
oG2antt.Template = [Background(41) = 33554433] // oG2antt.Background(41) = 0x2000001
oG2antt.HeaderAppearance = 4
oG2antt.BackColorHeader = 0xffffff
oG2antt.HeaderHeight = 24
oG2antt.HeaderVisible = 1
var_Column = oG2antt.Columns.Add("1st col")
	var_Column.DisplayFilterButton = true
	var_Column.DisplayFilterPattern = false
	var_Column.Filter = "Item B"
	var_Column.FilterType = 240
oG2antt.Columns.Add("2nd col")
var_Items = oG2antt.Items
	var_Items.AddItem("Item A")
	var_Items.AddItem("Item B")
	var_Items.AddItem("Item C")
oG2antt.ApplyFilter()
oG2antt.EndUpdate()
|
|
2349
|
Stack vs Cascade
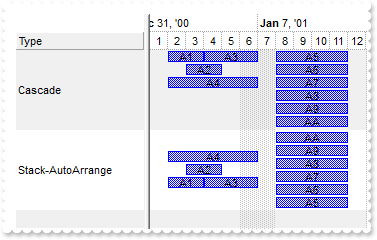
local h,oG2antt,var_Bar,var_Bar1,var_Chart,var_Items

oG2antt = form.EXG2ANTTCHARTACTIVEXCONTROL1.nativeObject
oG2antt.BeginUpdate()
oG2antt.ScrollBySingleLine = true
oG2antt.HeaderAppearance = 1
oG2antt.Columns.Add("Type")
oG2antt.BackColorAlternate = 0xf0f0f0
var_Chart = oG2antt.Chart
	var_Chart.LevelCount = 2
	var_Chart.AllowCreateBar = 1
	var_Chart.AllowLinkBars = false
	var_Chart.ResizeUnitScale = 65536
	// var_Chart.PaneWidth(false) = 128
	with (oG2antt)
		TemplateDef = [dim var_Chart]
		TemplateDef = var_Chart
		Template = [var_Chart.PaneWidth(False) = 128]
	endwith
	var_Chart.FirstVisibleDate = "01/01/2001"
	var_Bar = var_Chart.Bars.Copy("Task","T1")
		var_Bar.OverlaidType = 4
		// var_Bar.Def(3) = "<%=%9%>"
		with (oG2antt)
			TemplateDef = [dim var_Bar]
			TemplateDef = var_Bar
			Template = [var_Bar.Def(3) = "<%=%9%>"]
		endwith
	var_Bar1 = var_Chart.Bars.Copy("Task","T2")
		var_Bar1.OverlaidType = 515 /*exOverlaidBarsStackAutoArrange | exOverlaidBarsStack*/
		// var_Bar1.Def(3) = "<%=%9%>"
		with (oG2antt)
			TemplateDef = [dim var_Bar1]
			TemplateDef = var_Bar1
			Template = [var_Bar1.Def(3) = "<%=%9%>"]
		endwith
var_Items = oG2antt.Items
	h = var_Items.AddItem("Cascade")
	var_Items.AddBar(h,"T1","01/02/2001","01/04/2001","A1")
	var_Items.AddBar(h,"T1","01/03/2001","01/05/2001","A2")
	var_Items.AddBar(h,"T1","01/04/2001","01/07/2001","A3")
	var_Items.AddBar(h,"T1","01/02/2001","01/07/2001","A4")
	var_Items.AddBar(h,"T1","01/08/2001","01/12/2001","A5")
	var_Items.AddBar(h,"T1","01/08/2001","01/12/2001","A6")
	var_Items.AddBar(h,"T1","01/08/2001","01/12/2001","A7")
	var_Items.AddBar(h,"T1","01/08/2001","01/12/2001","A8")
	var_Items.AddBar(h,"T1","01/08/2001","01/12/2001","A9")
	var_Items.AddBar(h,"T1","01/08/2001","01/12/2001","AA")
	h = var_Items.AddItem("Stack-AutoArrange")
	var_Items.AddBar(h,"T2","01/02/2001","01/04/2001","A1")
	var_Items.AddBar(h,"T2","01/03/2001","01/05/2001","A2")
	var_Items.AddBar(h,"T2","01/04/2001","01/07/2001","A3")
	var_Items.AddBar(h,"T2","01/02/2001","01/07/2001","A4")
	var_Items.AddBar(h,"T2","01/08/2001","01/12/2001","A5")
	var_Items.AddBar(h,"T2","01/08/2001","01/12/2001","A6")
	var_Items.AddBar(h,"T2","01/08/2001","01/12/2001","A7")
	var_Items.AddBar(h,"T2","01/08/2001","01/12/2001","A8")
	var_Items.AddBar(h,"T2","01/08/2001","01/12/2001","A9")
	var_Items.AddBar(h,"T2","01/08/2001","01/12/2001","AA")
oG2antt.EndUpdate()
|
|
2348
|
Horizontally(left) align the multi-line caption of the bar
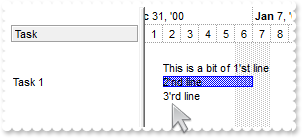
local h,oG2antt,var_Chart,var_Items

oG2antt = form.EXG2ANTTCHARTACTIVEXCONTROL1.nativeObject
oG2antt.BeginUpdate()
oG2antt.Columns.Add("Task")
oG2antt.HeaderAppearance = 4
var_Chart = oG2antt.Chart
	var_Chart.FirstVisibleDate = "01/01/2001"
	// var_Chart.PaneWidth(false) = 128
	with (oG2antt)
		TemplateDef = [dim var_Chart]
		TemplateDef = var_Chart
		Template = [var_Chart.PaneWidth(False) = 128]
	endwith
	var_Chart.LevelCount = 2
var_Items = oG2antt.Items
	// var_Items.SelectableItem(var_Items.AddItem()) = false
	with (oG2antt)
		TemplateDef = [dim var_Items]
		TemplateDef = var_Items
		Template = [var_Items.SelectableItem(AddItem()) = False]
	endwith
	h = var_Items.AddItem("Task 1")
	// var_Items.ItemHeight(h) = 42
	with (oG2antt)
		TemplateDef = [dim var_Items,h]
		TemplateDef = var_Items
		TemplateDef = h
		Template = [var_Items.ItemHeight(h) = 42]
	endwith
	var_Items.AddBar(h,"Task","01/02/2001","01/07/2001","K1","This is a bit of 1'st line<br>2'nd line<br>3'rd line")
	// var_Items.ItemBar(h,"K1",4) = 0
	with (oG2antt)
		TemplateDef = [dim var_Items,h]
		TemplateDef = var_Items
		TemplateDef = h
		Template = [var_Items.ItemBar(h,"K1",4) = 0]
	endwith
oG2antt.EndUpdate()
|
|
2347
|
Defines the colors, to display overlapping links
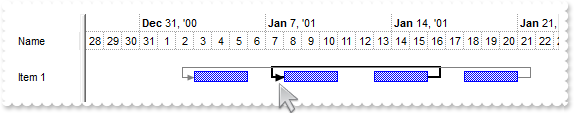
local h1,oG2antt,var_Chart,var_Items

oG2antt = form.EXG2ANTTCHARTACTIVEXCONTROL1.nativeObject
oG2antt.BeginUpdate()
oG2antt.Columns.Add("Name")
oG2antt.AntiAliasing = true
oG2antt.OverlapLinksColors = "black,gray,lightgray"
var_Chart = oG2antt.Chart
	var_Chart.LevelCount = 2
	var_Chart.FirstVisibleDate = "12/28/2000"
	// var_Chart.PaneWidth(false) = 64
	with (oG2antt)
		TemplateDef = [dim var_Chart]
		TemplateDef = var_Chart
		Template = [var_Chart.PaneWidth(False) = 64]
	endwith
	var_Chart.ShowLinks = 642 /*exChangeColorOnOverlap | exPreventOverlapMixt | exShowDefaultLinks*/
	var_Chart.NonworkingDays = 0
	var_Chart.LinksStyle = 0
var_Items = oG2antt.Items
	var_Items.AddItem("")
	h1 = var_Items.AddItem("Item 1")
	var_Items.AddBar(h1,"Task","01/03/2001","01/06/2001","A")
	var_Items.AddBar(h1,"Task","01/08/2001","01/11/2001","B")
	var_Items.AddBar(h1,"Task","01/13/2001","01/16/2001","C")
	var_Items.AddBar(h1,"Task","01/18/2001","01/21/2001","D")
	var_Items.AddLink("Link1",h1,"D",h1,"A")
	var_Items.AddLink("Link2",h1,"C",h1,"B")
oG2antt.EndUpdate()
|
|
2346
|
The exPreventOverlapMixt option can be combined with the exChangeColorOnOverlap flag, allowing overlapping links to alternately adjust their width while also changing colors
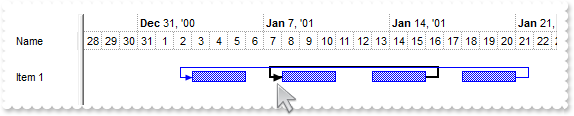
local h1,oG2antt,var_Chart,var_Items

oG2antt = form.EXG2ANTTCHARTACTIVEXCONTROL1.nativeObject
oG2antt.BeginUpdate()
oG2antt.Columns.Add("Name")
oG2antt.AntiAliasing = true
var_Chart = oG2antt.Chart
	var_Chart.LevelCount = 2
	var_Chart.FirstVisibleDate = "12/28/2000"
	// var_Chart.PaneWidth(false) = 64
	with (oG2antt)
		TemplateDef = [dim var_Chart]
		TemplateDef = var_Chart
		Template = [var_Chart.PaneWidth(False) = 64]
	endwith
	var_Chart.ShowLinks = 642 /*exChangeColorOnOverlap | exPreventOverlapMixt | exShowDefaultLinks*/
	var_Chart.NonworkingDays = 0
	var_Chart.LinksStyle = 0
var_Items = oG2antt.Items
	var_Items.AddItem("")
	h1 = var_Items.AddItem("Item 1")
	var_Items.AddBar(h1,"Task","01/03/2001","01/06/2001","A")
	var_Items.AddBar(h1,"Task","01/08/2001","01/11/2001","B")
	var_Items.AddBar(h1,"Task","01/13/2001","01/16/2001","C")
	var_Items.AddBar(h1,"Task","01/18/2001","01/21/2001","D")
	var_Items.AddLink("Link1",h1,"D",h1,"A")
	var_Items.AddLink("Link2",h1,"C",h1,"B")
oG2antt.EndUpdate()
|
|
2345
|
The exChangeColorOnOverlap flag changes the color for links in areas where they overlap with other links, enhancing clarity and distinction between them
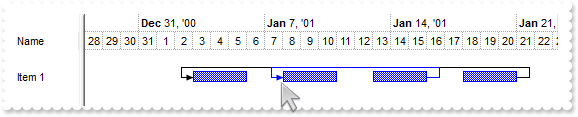
local h1,oG2antt,var_Chart,var_Items

oG2antt = form.EXG2ANTTCHARTACTIVEXCONTROL1.nativeObject
oG2antt.BeginUpdate()
oG2antt.AntiAliasing = true
oG2antt.Columns.Add("Name")
var_Chart = oG2antt.Chart
	var_Chart.LevelCount = 2
	var_Chart.FirstVisibleDate = "12/28/2000"
	// var_Chart.PaneWidth(false) = 64
	with (oG2antt)
		TemplateDef = [dim var_Chart]
		TemplateDef = var_Chart
		Template = [var_Chart.PaneWidth(False) = 64]
	endwith
	var_Chart.ShowLinks = 514 /*exChangeColorOnOverlap | exShowDefaultLinks*/
	var_Chart.NonworkingDays = 0
	var_Chart.LinksStyle = 0
var_Items = oG2antt.Items
	var_Items.AddItem("")
	h1 = var_Items.AddItem("Item 1")
	var_Items.AddBar(h1,"Task","01/03/2001","01/06/2001","A")
	var_Items.AddBar(h1,"Task","01/08/2001","01/11/2001","B")
	var_Items.AddBar(h1,"Task","01/13/2001","01/16/2001","C")
	var_Items.AddBar(h1,"Task","01/18/2001","01/21/2001","D")
	var_Items.AddLink("Link1",h1,"D",h1,"A")
	var_Items.AddLink("Link2",h1,"C",h1,"B")
oG2antt.EndUpdate()
|
|
2344
|
How can I assign a multiple-lines caption to an bar
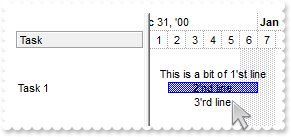
local h,oG2antt,var_Chart,var_Items

oG2antt = form.EXG2ANTTCHARTACTIVEXCONTROL1.nativeObject
oG2antt.BeginUpdate()
oG2antt.Columns.Add("Task")
oG2antt.HeaderAppearance = 4
var_Chart = oG2antt.Chart
	var_Chart.FirstVisibleDate = "01/01/2001"
	// var_Chart.PaneWidth(false) = 128
	with (oG2antt)
		TemplateDef = [dim var_Chart]
		TemplateDef = var_Chart
		Template = [var_Chart.PaneWidth(False) = 128]
	endwith
	var_Chart.LevelCount = 2
var_Items = oG2antt.Items
	// var_Items.SelectableItem(var_Items.AddItem()) = false
	with (oG2antt)
		TemplateDef = [dim var_Items]
		TemplateDef = var_Items
		Template = [var_Items.SelectableItem(AddItem()) = False]
	endwith
	h = var_Items.AddItem("Task 1")
	// var_Items.ItemHeight(h) = 42
	with (oG2antt)
		TemplateDef = [dim var_Items,h]
		TemplateDef = var_Items
		TemplateDef = h
		Template = [var_Items.ItemHeight(h) = 42]
	endwith
	var_Items.AddBar(h,"Task","01/02/2001","01/07/2001","K1")
	// var_Items.ItemBar(h,"K1",3) = "This is a bit of 1'st line<br>2'nd line<br>3'rd line"
	with (oG2antt)
		TemplateDef = [dim var_Items,h]
		TemplateDef = var_Items
		TemplateDef = h
		Template = [var_Items.ItemBar(h,"K1",3) = "This is a bit of 1'st line<br>2'nd line<br>3'rd line"]
	endwith
oG2antt.EndUpdate()
|
|
2343
|
The text on the chart overlap the rest of the bars, while using OverlaidType property on exOverlaidBarsStack
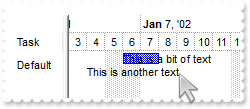
local h,oG2antt,var_Bar,var_Bar1,var_Chart,var_Items

oG2antt = form.EXG2ANTTCHARTACTIVEXCONTROL1.nativeObject
oG2antt.BeginUpdate()
var_Chart = oG2antt.Chart
	// var_Chart.PaneWidth(false) = 48
	with (oG2antt)
		TemplateDef = [dim var_Chart]
		TemplateDef = var_Chart
		Template = [var_Chart.PaneWidth(False) = 48]
	endwith
	var_Chart.FirstVisibleDate = "01/03/2002"
	var_Chart.LevelCount = 2
	var_Chart.FirstWeekDay = 1
	// var_Chart.Bars.Add("Text").Def(4) = 0
	var_Bar = var_Chart.Bars.Add("Text")
	with (oG2antt)
		TemplateDef = [dim var_Bar]
		TemplateDef = var_Bar
		Template = [var_Bar.Def(4) = 0]
	endwith
	var_Bar1 = var_Chart.Bars.Item("Task")
		// var_Bar1.Def(4) = 0
		with (oG2antt)
			TemplateDef = [dim var_Bar1]
			TemplateDef = var_Bar1
			Template = [var_Bar1.Def(4) = 0]
		endwith
		var_Bar1.OverlaidType = 4611 /*exOverlaidBarsIncludeCaption | exOverlaidBarsStackAutoArrange | exOverlaidBarsStack*/
		var_Bar1.OverlaidGroup = "Text,Task"
oG2antt.Columns.Add("Task")
var_Items = oG2antt.Items
	h = var_Items.AddItem("Default")
	var_Items.AddBar(h,"Text","01/04/2002","01/04/2002","","This is another text")
	var_Items.AddBar(h,"Task","01/06/2002","01/08/2002","A","This is a bit of text")
oG2antt.EndUpdate()
|
|
2342
|
We are running our application on an Azure server using RDP, with the server language set to English. However, my client has their national language set to Swedish, but the tooltip is displaying dates in the English format (mm/dd/yyyy) instead of the Swedish format (yyyy-mm-dd) (method 2)
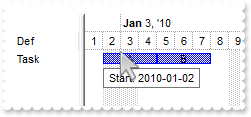
local h,oG2antt,var_Bars,var_Chart,var_Items

oG2antt = form.EXG2ANTTCHARTACTIVEXCONTROL1.nativeObject
oG2antt.BeginUpdate()
oG2antt.Columns.Add("Def")
var_Chart = oG2antt.Chart
	var_Chart.AllowCreateBar = 0
	// var_Chart.PaneWidth(false) = 64
	with (oG2antt)
		TemplateDef = [dim var_Chart]
		TemplateDef = var_Chart
		Template = [var_Chart.PaneWidth(False) = 64]
	endwith
	var_Chart.LevelCount = 2
	var_Chart.FirstVisibleDate = "01/01/2010"
	// var_Chart.Bars.Item("Task").Def(6) = "<%=`Start: ` + (date(%1) format `yyyy-MM-dd` )%>"
	var_Bars = var_Chart.Bars.Item("Task")
	with (oG2antt)
		TemplateDef = [dim var_Bars]
		TemplateDef = var_Bars
		Template = [var_Bars.Def(6) = "<%=`Start: ` + (date(%1) format `yyyy-MM-dd` )%>"]
	endwith
var_Items = oG2antt.Items
	h = var_Items.AddItem("Task")
	var_Items.AddBar(h,"Task","01/02/2010","01/05/2010","A","A")
	var_Items.AddBar(h,"Task","01/05/2010","01/08/2010","B","B")
oG2antt.EndUpdate()
|
|
2341
|
We are running our application on an Azure server using RDP, with the server language set to English. However, my client has their national language set to Swedish, but the tooltip is displaying dates in the English format (mm/dd/yyyy) instead of the Swedish format (yyyy-mm-dd) (method 1)
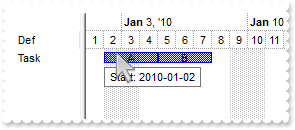
local h,oG2antt,var_Bars,var_Chart,var_Items

oG2antt = form.EXG2ANTTCHARTACTIVEXCONTROL1.nativeObject
oG2antt.BeginUpdate()
oG2antt.Columns.Add("Def")
var_Chart = oG2antt.Chart
	var_Chart.AllowCreateBar = 0
	// var_Chart.PaneWidth(false) = 64
	with (oG2antt)
		TemplateDef = [dim var_Chart]
		TemplateDef = var_Chart
		Template = [var_Chart.PaneWidth(False) = 64]
	endwith
	var_Chart.LevelCount = 2
	var_Chart.FirstVisibleDate = "01/01/2010"
	// var_Chart.Bars.Item("Task").Def(6) = "<%=`Start: ` + year(%1) + `-` + (month(%1) lpad `00`) + `-` + (day(%1) lpad `00`)%>"
	var_Bars = var_Chart.Bars.Item("Task")
	with (oG2antt)
		TemplateDef = [dim var_Bars]
		TemplateDef = var_Bars
		Template = [var_Bars.Def(6) = "<%=`Start: ` + year(%1) + `-` + (month(%1) lpad `00`) + `-` + (day(%1) lpad `00`)%>"]
	endwith
var_Items = oG2antt.Items
	h = var_Items.AddItem("Task")
	var_Items.AddBar(h,"Task","01/02/2010","01/05/2010","A","A")
	var_Items.AddBar(h,"Task","01/05/2010","01/08/2010","B","B")
oG2antt.EndUpdate()
|
|
2340
|
How can I replace or add an icon at runtime
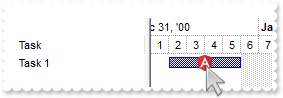
local h,oG2antt,var_Chart,var_Items

oG2antt = form.EXG2ANTTCHARTACTIVEXCONTROL1.nativeObject
oG2antt.BeginUpdate()
oG2antt.ReplaceIcon("gAAAABgYACEHgUJFEEAAWhUJCEJEEJggEhMCYEXjUbjkJQECj8gj8hAEjkshYEpk8kf8ClsulsvAExmcvf83js5nU7nkCeEcn8boMaocXosCB9Hn09pkzcEuoL/fE+OkYB0gB9YhIHrddgVcr9aktZADAD8+P8CgIA==")
oG2antt.ReplaceIcon("C:\images\favicon.ico",0)
oG2antt.Columns.Add("Task")
var_Chart = oG2antt.Chart
	var_Chart.FirstVisibleDate = "01/01/2001"
	// var_Chart.PaneWidth(false) = 128
	with (oG2antt)
		TemplateDef = [dim var_Chart]
		TemplateDef = var_Chart
		Template = [var_Chart.PaneWidth(False) = 128]
	endwith
	var_Chart.LevelCount = 2
var_Items = oG2antt.Items
	h = var_Items.AddItem("Task 1")
	var_Items.AddBar(h,"Task","01/02/2001","01/06/2001","K1")
	// var_Items.ItemBar(h,"K1",3) = "<img>1</img>"
	with (oG2antt)
		TemplateDef = [dim var_Items,h]
		TemplateDef = var_Items
		TemplateDef = h
		Template = [var_Items.ItemBar(h,"K1",3) = "<img>1</img>"]
	endwith
oG2antt.EndUpdate()
|
|
2339
|
How can I define the sensitivity for link selection when the user clicks or selects a link
/*
with (this.EXG2ANTTCHARTACTIVEXCONTROL1.nativeObject)
	MouseMove = class::nativeObject_MouseMove
endwith
*/
// Occurs when the user moves the mouse.
function nativeObject_MouseMove(Button, Shift, X, Y)
	oG2antt = form.EXG2ANTTCHARTACTIVEXCONTROL1.nativeObject
	? Str(oG2antt.Chart.LinkFromPoint(-1,-1))
return

local h1,h2,h3,oG2antt,var_Chart,var_Items

oG2antt = form.EXG2ANTTCHARTACTIVEXCONTROL1.nativeObject
oG2antt.BeginUpdate()
oG2antt.Columns.Add("Task")
var_Chart = oG2antt.Chart
	var_Chart.FirstVisibleDate = "12/29/2000"
	// var_Chart.PaneWidth(false) = 64
	with (oG2antt)
		TemplateDef = [dim var_Chart]
		TemplateDef = var_Chart
		Template = [var_Chart.PaneWidth(False) = 64]
	endwith
	var_Chart.LevelCount = 2
	var_Chart.LinksWidth = 1026
var_Items = oG2antt.Items
	h1 = var_Items.AddItem("Task 1")
	var_Items.AddBar(h1,"Task","01/02/2001","01/04/2001","K1")
	var_Items.AddItem()
	h2 = var_Items.AddItem("Task 2")
	var_Items.AddBar(h2,"Task","01/08/2001","01/10/2001","K2")
	var_Items.AddLink("L1",h1,"K1",h2,"K2")
	var_Items.AddItem()
	h3 = var_Items.AddItem("Task 3")
	var_Items.AddBar(h3,"Task","01/14/2001","01/16/2001","K3")
	var_Items.AddLink("L2",h2,"K2",h3,"K3")
oG2antt.EndUpdate()
|
|
2338
|
How can I let the user to create task-bars for leaf0-items only, when AllowCreateBar is exCreateBarAuto
/*
with (this.EXG2ANTTCHARTACTIVEXCONTROL1.nativeObject)
	CreateBar = class::nativeObject_CreateBar
endwith
*/
// Fired when the user creates a new bar.
function nativeObject_CreateBar(Item, DateStart, DateEnd)
	local var_Items
	oG2antt = form.EXG2ANTTCHARTACTIVEXCONTROL1.nativeObject
	var_Items = oG2antt.Items
		? "Call RemoveBar if the ChildCount property returns a non-zero value"
		? Str(var_Items.ChildCount(Item))
		var_Items.RemoveBar(Item,"newbar")
return

local h,oG2antt,var_Chart,var_Items

oG2antt = form.EXG2ANTTCHARTACTIVEXCONTROL1.nativeObject
oG2antt.BeginUpdate()
oG2antt.LinesAtRoot = -1
oG2antt.HeaderVisible = 1
oG2antt.HeaderAppearance = 4
var_Chart = oG2antt.Chart
	var_Chart.AllowCreateBar = 1
	var_Chart.LevelCount = 2
	// var_Chart.PaneWidth(false) = 128
	with (oG2antt)
		TemplateDef = [dim var_Chart]
		TemplateDef = var_Chart
		Template = [var_Chart.PaneWidth(False) = 128]
	endwith
oG2antt.Columns.Add("Task")
var_Items = oG2antt.Items
	h = var_Items.AddItem("Root")
	var_Items.InsertItem(h,null,"Child 1")
	var_Items.InsertItem(h,null,"Child 2")
	// var_Items.ExpandItem(h) = true
	with (oG2antt)
		TemplateDef = [dim var_Items,h]
		TemplateDef = var_Items
		TemplateDef = h
		Template = [var_Items.ExpandItem(h) = True]
	endwith
oG2antt.EndUpdate()
|
|
2337
|
How can I convert the exBarStart/exBarEnd property to a string (by default it returns as VARIANT/VT_DATE type, method 3)
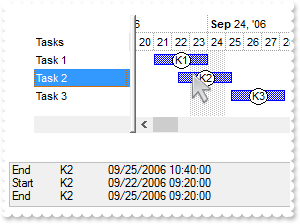
/*
with (this.EXG2ANTTCHARTACTIVEXCONTROL1.nativeObject)
	BarResizing = class::nativeObject_BarResizing
endwith
*/
// Occurs when a bar is moving or resizing.
function nativeObject_BarResizing(Item, Key)
	oG2antt = form.EXG2ANTTCHARTACTIVEXCONTROL1.nativeObject
	? "Start"
	? Str(Key)
	? Str(oG2antt.Items.ItemBar(Item,Key,547))
	? "End"
	? Str(Key)
	? Str(oG2antt.Items.ItemBar(Item,Key,548))
return

local oG2antt,var_Chart,var_Items

oG2antt = form.EXG2ANTTCHARTACTIVEXCONTROL1.nativeObject
oG2antt.BeginUpdate()
oG2antt.Columns.Add("Tasks")
oG2antt.Debug = true
var_Chart = oG2antt.Chart
	var_Chart.FirstVisibleDate = "09/20/2006"
	var_Chart.LevelCount = 2
	// var_Chart.PaneWidth(false) = 96
	with (oG2antt)
		TemplateDef = [dim var_Chart]
		TemplateDef = var_Chart
		Template = [var_Chart.PaneWidth(0) = 96]
	endwith
	var_Chart.ResizeUnitScale = 1048576
var_Items = oG2antt.Items
	var_Items.AddBar(var_Items.AddItem("Task 1"),"Task","09/21/2006","09/24/2006","K1")
	var_Items.AddBar(var_Items.AddItem("Task 2"),"Task","09/22/2006","09/25/2006","K2")
	var_Items.AddBar(var_Items.AddItem("Task 3"),"Task","09/23/2006","09/26/2006","K3")
oG2antt.EndUpdate()
|
|
2336
|
How can I convert the exBarStart/exBarEnd property to a string (by default it returns as VARIANT/VT_DATE type, method 2)
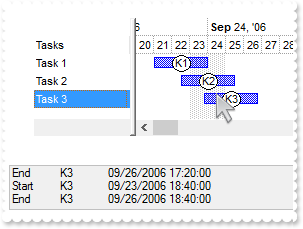
/*
with (this.EXG2ANTTCHARTACTIVEXCONTROL1.nativeObject)
	BarResizing = class::nativeObject_BarResizing
endwith
*/
// Occurs when a bar is moving or resizing.
function nativeObject_BarResizing(Item, Key)
	oG2antt = form.EXG2ANTTCHARTACTIVEXCONTROL1.nativeObject
	? "Start"
	? Str(Key)
	? Str(oG2antt.FormatABC("dateF(value)",oG2antt.Items.ItemBar(Item,Key,1)))
	? "End"
	? Str(Key)
	? Str(oG2antt.FormatABC("dateF(value)",oG2antt.Items.ItemBar(Item,Key,2)))
return

local oG2antt,var_Chart,var_Items

oG2antt = form.EXG2ANTTCHARTACTIVEXCONTROL1.nativeObject
oG2antt.BeginUpdate()
oG2antt.Columns.Add("Tasks")
oG2antt.Debug = true
var_Chart = oG2antt.Chart
	var_Chart.FirstVisibleDate = "09/20/2006"
	var_Chart.LevelCount = 2
	// var_Chart.PaneWidth(false) = 96
	with (oG2antt)
		TemplateDef = [dim var_Chart]
		TemplateDef = var_Chart
		Template = [var_Chart.PaneWidth(0) = 96]
	endwith
	var_Chart.ResizeUnitScale = 1048576
var_Items = oG2antt.Items
	var_Items.AddBar(var_Items.AddItem("Task 1"),"Task","09/21/2006","09/24/2006","K1")
	var_Items.AddBar(var_Items.AddItem("Task 2"),"Task","09/22/2006","09/25/2006","K2")
	var_Items.AddBar(var_Items.AddItem("Task 3"),"Task","09/23/2006","09/26/2006","K3")
oG2antt.EndUpdate()
|
|
2335
|
How can I convert the exBarStart/exBarEnd property to a string (by default it returns as VARIANT/VT_DATE type, method 1)
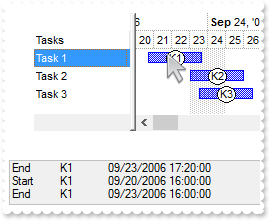
/*
with (this.EXG2ANTTCHARTACTIVEXCONTROL1.nativeObject)
	BarResizing = class::nativeObject_BarResizing
endwith
*/
// Occurs when a bar is moving or resizing.
function nativeObject_BarResizing(Item, Key)
	oG2antt = form.EXG2ANTTCHARTACTIVEXCONTROL1.nativeObject
	? "Start"
	? Str(Key)
	? Str(oG2antt.FormatABC("date(value) format `MM/dd/yyyy HH:mm:ss`",oG2antt.Items.ItemBar(Item,Key,1)))
	? "End"
	? Str(Key)
	? Str(oG2antt.FormatABC("date(value) format `MM/dd/yyyy HH:mm:ss`",oG2antt.Items.ItemBar(Item,Key,2)))
return

local oG2antt,var_Chart,var_Items

oG2antt = form.EXG2ANTTCHARTACTIVEXCONTROL1.nativeObject
oG2antt.BeginUpdate()
oG2antt.Columns.Add("Tasks")
oG2antt.Debug = true
var_Chart = oG2antt.Chart
	var_Chart.FirstVisibleDate = "09/20/2006"
	var_Chart.LevelCount = 2
	// var_Chart.PaneWidth(false) = 96
	with (oG2antt)
		TemplateDef = [dim var_Chart]
		TemplateDef = var_Chart
		Template = [var_Chart.PaneWidth(0) = 96]
	endwith
	var_Chart.ResizeUnitScale = 1048576
var_Items = oG2antt.Items
	var_Items.AddBar(var_Items.AddItem("Task 1"),"Task","09/21/2006","09/24/2006","K1")
	var_Items.AddBar(var_Items.AddItem("Task 2"),"Task","09/22/2006","09/25/2006","K2")
	var_Items.AddBar(var_Items.AddItem("Task 3"),"Task","09/23/2006","09/26/2006","K3")
oG2antt.EndUpdate()
|
|
2334
|
Add/Remove/Updates the item-bar's resources
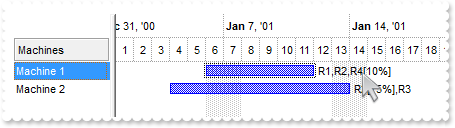
/*
with (this.EXG2ANTTCHARTACTIVEXCONTROL1.nativeObject)
	Click = class::nativeObject_Click
endwith
*/
// Occurs when the user presses and then releases the left mouse button over the tree control.
function nativeObject_Click()
	local h,var_Items
	oG2antt = form.EXG2ANTTCHARTACTIVEXCONTROL1.nativeObject
	var_Items = oG2antt.Items
		h = var_Items.SelectedItem(0)
		// var_Items.ItemBar(h,var_Items.FirstItemBar(h),49) = "+R4[10%]"
		with (oG2antt)
			TemplateDef = [dim var_Items,h]
			TemplateDef = var_Items
			TemplateDef = h
			Template = [var_Items.ItemBar(h,FirstItemBar(h),49) = "+R4[10%]"]
		endwith
return

local h,oG2antt,var_Bar,var_Chart,var_Items

oG2antt = form.EXG2ANTTCHARTACTIVEXCONTROL1.nativeObject
oG2antt.BeginUpdate()
oG2antt.HeaderAppearance = 4
oG2antt.HeaderHeight = 24
var_Chart = oG2antt.Chart
	// var_Chart.PaneWidth(false) = 96
	with (oG2antt)
		TemplateDef = [dim var_Chart]
		TemplateDef = var_Chart
		Template = [var_Chart.PaneWidth(False) = 96]
	endwith
	var_Chart.LevelCount = 2
	var_Chart.FirstVisibleDate = "01/01/2001"
	var_Bar = var_Chart.Bars.Item("Task")
		// var_Bar.Def(4) = 18
		with (oG2antt)
			TemplateDef = [dim var_Bar]
			TemplateDef = var_Bar
			Template = [var_Bar.Def(4) = 18]
		endwith
		// var_Bar.Def(3) = "<%=%49%>"
		with (oG2antt)
			TemplateDef = [dim var_Bar]
			TemplateDef = var_Bar
			Template = [var_Bar.Def(3) = "<%=%49%>"]
		endwith
oG2antt.Columns.Add("Machines")
var_Items = oG2antt.Items
	h = var_Items.AddItem("Machine 1")
	var_Items.AddBar(h,"Task","01/06/2001","01/12/2001","K1")
	// var_Items.ItemBar(h,"K1",49) = "R1,R2"
	with (oG2antt)
		TemplateDef = [dim var_Items,h]
		TemplateDef = var_Items
		TemplateDef = h
		Template = [var_Items.ItemBar(h,"K1",49) = "R1,R2"]
	endwith
	h = var_Items.AddItem("Machine 2")
	var_Items.AddBar(h,"Task","01/04/2001","01/14/2001","K2")
	// var_Items.ItemBar(h,"K2",49) = "R2[75%],R3"
	with (oG2antt)
		TemplateDef = [dim var_Items,h]
		TemplateDef = var_Items
		TemplateDef = h
		Template = [var_Items.ItemBar(h,"K2",49) = "R2[75%],R3"]
	endwith
oG2antt.EndUpdate()
|
|
2333
|
Distributes resources to a bar
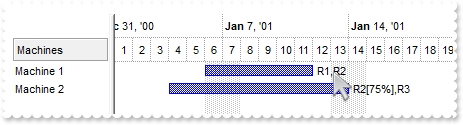
local h,oG2antt,var_Bar,var_Chart,var_Items

oG2antt = form.EXG2ANTTCHARTACTIVEXCONTROL1.nativeObject
oG2antt.BeginUpdate()
oG2antt.HeaderAppearance = 4
oG2antt.HeaderHeight = 24
var_Chart = oG2antt.Chart
	// var_Chart.PaneWidth(false) = 96
	with (oG2antt)
		TemplateDef = [dim var_Chart]
		TemplateDef = var_Chart
		Template = [var_Chart.PaneWidth(False) = 96]
	endwith
	var_Chart.LevelCount = 2
	var_Chart.FirstVisibleDate = "01/01/2001"
	var_Bar = var_Chart.Bars.Item("Task")
		// var_Bar.Def(4) = 18
		with (oG2antt)
			TemplateDef = [dim var_Bar]
			TemplateDef = var_Bar
			Template = [var_Bar.Def(4) = 18]
		endwith
		// var_Bar.Def(3) = "<%=%49%>"
		with (oG2antt)
			TemplateDef = [dim var_Bar]
			TemplateDef = var_Bar
			Template = [var_Bar.Def(3) = "<%=%49%>"]
		endwith
oG2antt.Columns.Add("Machines")
var_Items = oG2antt.Items
	h = var_Items.AddItem("Machine 1")
	var_Items.AddBar(h,"Task","01/06/2001","01/12/2001","K1")
	// var_Items.ItemBar(h,"K1",49) = "R1,R2"
	with (oG2antt)
		TemplateDef = [dim var_Items,h]
		TemplateDef = var_Items
		TemplateDef = h
		Template = [var_Items.ItemBar(h,"K1",49) = "R1,R2"]
	endwith
	h = var_Items.AddItem("Machine 2")
	var_Items.AddBar(h,"Task","01/04/2001","01/14/2001","K2")
	// var_Items.ItemBar(h,"K2",49) = "R2[75%],R3"
	with (oG2antt)
		TemplateDef = [dim var_Items,h]
		TemplateDef = var_Items
		TemplateDef = h
		Template = [var_Items.ItemBar(h,"K2",49) = "R2[75%],R3"]
	endwith
oG2antt.EndUpdate()
|
|
2332
|
How can I display additional information about a time zone when the user clicks on it (expandable)
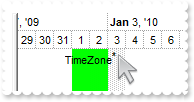
local oG2antt,var_Chart

oG2antt = form.EXG2ANTTCHARTACTIVEXCONTROL1.nativeObject
var_Chart = oG2antt.Chart
	// var_Chart.PaneWidth(false) = 0
	with (oG2antt)
		TemplateDef = [dim var_Chart]
		TemplateDef = var_Chart
		Template = [var_Chart.PaneWidth(False) = 0]
	endwith
	var_Chart.LevelCount = 2
	var_Chart.FirstVisibleDate = "12/20/2009"
	var_Chart.MarkTimeZone("TZ","01/01/2010","01/03/2010",65280,"1;;<c>TimeZone<b><off -4><a ;exp=just more info about>*</a></b>;1")
|
|
2331
|
How can I have a tooltip for a marked TimeZone
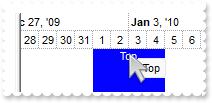
/*
with (this.EXG2ANTTCHARTACTIVEXCONTROL1.nativeObject)
	MouseMove = class::nativeObject_MouseMove
endwith
*/
// Occurs when the user moves the mouse.
function nativeObject_MouseMove(Button, Shift, X, Y)
	oG2antt = form.EXG2ANTTCHARTACTIVEXCONTROL1.nativeObject
	oG2antt.ShowToolTip(oG2antt.Chart.TimeZoneFromPoint(-1,-1),"",null,"+8")
return

local oG2antt,var_Chart

oG2antt = form.EXG2ANTTCHARTACTIVEXCONTROL1.nativeObject
var_Chart = oG2antt.Chart
	// var_Chart.PaneWidth(false) = 0
	with (oG2antt)
		TemplateDef = [dim var_Chart]
		TemplateDef = var_Chart
		Template = [var_Chart.PaneWidth(False) = 0]
	endwith
	var_Chart.LevelCount = 2
	var_Chart.FirstVisibleDate = "12/28/2009"
	var_Chart.MarkTimeZone("Top","01/01/2010","01/05/2010",16711680,"1;;<fgcolor=FFFFFF>Top;1")
	var_Chart.MarkTimeZone("Partial","01/08/2010","01/12/2010",16711680,"50;;<fgcolor=FFFFFF>Partial;1")
	var_Chart.MarkTimeZone("Default","01/15/2010","01/19/2010",16711680,";;<fgcolor=FFFFFF>Default;1")
|
|
2330
|
Can I set a filter that automatically adds a * before and after the word, so the user can just search for 'cat' and it becomes '*cat*' automatically
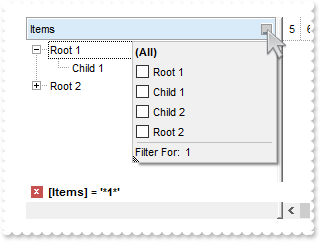
local h,oG2antt,var_Column,var_Items

oG2antt = form.EXG2ANTTCHARTACTIVEXCONTROL1.nativeObject
oG2antt.BeginUpdate()
oG2antt.HeaderAppearance = 4
oG2antt.HeaderHeight = 24
oG2antt.LinesAtRoot = -1
var_Column = oG2antt.Columns.Add("Items")
	var_Column.DisplayFilterButton = true
	var_Column.DisplayFilterPattern = true
	// var_Column.Def(21) = "*<%filter%>*"
	with (oG2antt)
		TemplateDef = [dim var_Column]
		TemplateDef = var_Column
		Template = [var_Column.Def(21) = "*<%filter%>*"]
	endwith
	var_Column.FilterType = 3
	var_Column.Filter = "1"
var_Items = oG2antt.Items
	h = var_Items.AddItem("Root 1")
	var_Items.InsertItem(h,null,"Child 1")
	var_Items.InsertItem(h,null,"Child 2")
	// var_Items.ExpandItem(h) = true
	with (oG2antt)
		TemplateDef = [dim var_Items,h]
		TemplateDef = var_Items
		TemplateDef = h
		Template = [var_Items.ExpandItem(h) = True]
	endwith
	h = var_Items.AddItem("Root 2")
	var_Items.InsertItem(h,null,"Child 1")
	var_Items.InsertItem(h,null,"Child 2")
oG2antt.ApplyFilter()
oG2antt.EndUpdate()
|
|
2329
|
The fine dotted lines in the control appear much thicker than the standard ones we've been using. How can we fix this
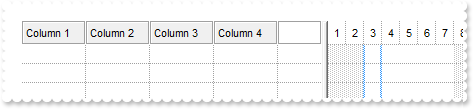
local oG2antt,var_Chart

oG2antt = form.EXG2ANTTCHARTACTIVEXCONTROL1.nativeObject
oG2antt.BeginUpdate()
oG2antt.HeaderAppearance = 4
oG2antt.HeaderHeight = 24
oG2antt.DrawGridLines = -1
oG2antt.GridLineStyle = 512
var_Chart = oG2antt.Chart
	var_Chart.GridLineStyle = 512
	var_Chart.DrawGridLines = -1
oG2antt.ColumnAutoResize = false
oG2antt.Columns.Add("Column 1")
oG2antt.Columns.Add("Column 2")
oG2antt.Columns.Add("Column 3")
oG2antt.Columns.Add("Column 4")
oG2antt.EndUpdate()
|
|
2328
|
Load data as a tree using a parent-id relationship
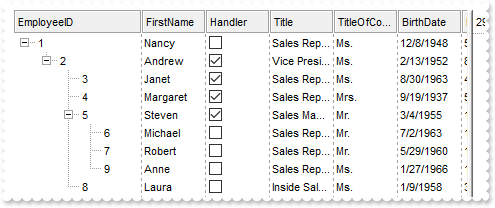
local oG2antt,rs,var_Items

oG2antt = form.EXG2ANTTCHARTACTIVEXCONTROL1.nativeObject
oG2antt.BeginUpdate()
oG2antt.ColumnAutoResize = false
oG2antt.HeaderAppearance = 4
oG2antt.HeaderHeight = 24
oG2antt.DrawGridLines = 2
oG2antt.LinesAtRoot = -1
rs = new OleAutoClient("ADODB.Recordset")
	rs.Open("Select * FROM Employees WHERE 1=0","Provider=Microsoft.ACE.OLEDB.12.0;Data Source=C:\Program Files\Exontrol\ExG2antt\Sample\Access\misc.mdb",3,3)
oG2antt.DataSource = rs
oG2antt.Columns.Item(0).Width = 128
rs = new OleAutoClient("ADODB.Recordset")
	rs.Open("Employees","Provider=Microsoft.ACE.OLEDB.12.0;Data Source=C:\Program Files\Exontrol\ExG2antt\Sample\Access\misc.mdb",3,3)
oG2antt.PutItems(rs.GetRows(),";0;17")
// oG2antt.Items.ExpandItem(0) = true
var_Items = oG2antt.Items
with (oG2antt)
	TemplateDef = [dim var_Items]
	TemplateDef = var_Items
	Template = [var_Items.ExpandItem(0) = True]
endwith
oG2antt.EndUpdate()
|
|
2327
|
Is there a way to change the contents of the drop down editor based on a value in another column
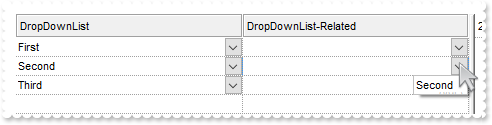
/*
with (this.EXG2ANTTCHARTACTIVEXCONTROL1.nativeObject)
	AddItem = class::nativeObject_AddItem
endwith
*/
// Occurs after a new Item has been inserted to Items collection.
function nativeObject_AddItem(Item)
	local var_Items,var_Items1
	oG2antt = form.EXG2ANTTCHARTACTIVEXCONTROL1.nativeObject
	// oG2antt.Items.CellEditorVisible(Item,0) = 1
	var_Items = oG2antt.Items
	with (oG2antt)
		TemplateDef = [dim var_Items]
		TemplateDef = var_Items
		Template = [var_Items.CellEditorVisible(Item,0) = 1]
	endwith
	// oG2antt.Items.CellEditorVisible(Item,1) = 1
	var_Items1 = oG2antt.Items
	with (oG2antt)
		TemplateDef = [dim var_Items1]
		TemplateDef = var_Items1
		Template = [var_Items1.CellEditorVisible(Item,1) = 1]
	endwith
return

/*
with (this.EXG2ANTTCHARTACTIVEXCONTROL1.nativeObject)
	EditOpen = class::nativeObject_EditOpen
endwith
*/
// Occurs when the edit operation starts.
function nativeObject_EditOpen()
	local c,v,var_Editor,var_Items
	oG2antt = form.EXG2ANTTCHARTACTIVEXCONTROL1.nativeObject
	var_Items = oG2antt.Items
		v = var_Items.CellValue(var_Items.FocusItem,0)
		c = var_Items.CellCaption(var_Items.FocusItem,0)
	var_Editor = oG2antt.Columns.Item(1).Editor
		var_Editor.ClearItems()
		var_Editor.AddItem(v,Str(c))
return

local h,oG2antt,var_Column,var_Editor,var_Editor1,var_Items

oG2antt = form.EXG2ANTTCHARTACTIVEXCONTROL1.nativeObject
oG2antt.BeginUpdate()
oG2antt.HeaderAppearance = 4
oG2antt.HeaderHeight = 24
oG2antt.GridLineStyle = 512
var_Column = oG2antt.Columns.Add("DropDownList")
	var_Editor = var_Column.Editor
		var_Editor.EditType = 3
		var_Editor.AddItem(1,"First")
		var_Editor.AddItem(2,"Second")
		var_Editor.AddItem(3,"Third")
oG2antt.DrawGridLines = -1
// oG2antt.Columns.Add("DropDownList-Related").Editor.EditType = 3
var_Editor1 = oG2antt.Columns.Add("DropDownList-Related").Editor
with (oG2antt)
	TemplateDef = [dim var_Editor1]
	TemplateDef = var_Editor1
	Template = [var_Editor1.EditType = 3]
endwith
var_Items = oG2antt.Items
	// var_Items.CellValue(var_Items.AddItem(1),1) = -1
	with (oG2antt)
		TemplateDef = [dim var_Items]
		TemplateDef = var_Items
		Template = [var_Items.CellValue(AddItem(1),1) = -1]
	endwith
	// var_Items.CellValue(var_Items.AddItem(2),1) = -1
	with (oG2antt)
		TemplateDef = [dim var_Items]
		TemplateDef = var_Items
		Template = [var_Items.CellValue(AddItem(2),1) = -1]
	endwith
	// var_Items.CellValue(var_Items.AddItem(3),1) = -1
	with (oG2antt)
		TemplateDef = [dim var_Items]
		TemplateDef = var_Items
		Template = [var_Items.CellValue(AddItem(3),1) = -1]
	endwith
	// var_Items.LockedItemCount(2) = 1
	with (oG2antt)
		TemplateDef = [dim var_Items]
		TemplateDef = var_Items
		Template = [var_Items.LockedItemCount(2) = 1]
	endwith
	h = var_Items.LockedItem(2,0)
	// var_Items.ItemDivider(h) = 0
	with (oG2antt)
		TemplateDef = [dim var_Items,h]
		TemplateDef = var_Items
		TemplateDef = h
		Template = [var_Items.ItemDivider(h) = 0]
	endwith
	// var_Items.ItemDividerLineAlignment(h) = 2
	with (oG2antt)
		TemplateDef = [dim var_Items,h]
		TemplateDef = var_Items
		TemplateDef = h
		Template = [var_Items.ItemDividerLineAlignment(h) = 2]
	endwith
	// var_Items.CellEditorVisible(h,0) = false
	with (oG2antt)
		TemplateDef = [dim var_Items,h]
		TemplateDef = var_Items
		TemplateDef = h
		Template = [var_Items.CellEditorVisible(h,0) = False]
	endwith
	// var_Items.CellSingleLine(h,0) = false
	with (oG2antt)
		TemplateDef = [dim var_Items,h]
		TemplateDef = var_Items
		TemplateDef = h
		Template = [var_Items.CellSingleLine(h,0) = False]
	endwith
	// var_Items.CellValueFormat(h,0) = 1
	with (oG2antt)
		TemplateDef = [dim var_Items,h]
		TemplateDef = var_Items
		TemplateDef = h
		Template = [var_Items.CellValueFormat(h,0) = 1]
	endwith
	// var_Items.CellValue(h,0) = "The drop down editor in the second column is filled during the <b>EditOpen event</b>, and the values are based on the selection on the first column."
	with (oG2antt)
		TemplateDef = [dim var_Items,h]
		TemplateDef = var_Items
		TemplateDef = h
		Template = [var_Items.CellValue(h,0) = "The drop down editor in the second column is filled during the <b>EditOpen event</b>, and the values are based on the selection on the first column."]
	endwith
oG2antt.EndUpdate()
|
|
2326
|
Highlight the editable fields
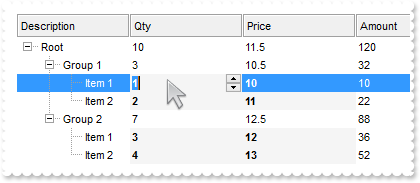
/*
with (this.EXG2ANTTCHARTACTIVEXCONTROL1.nativeObject)
	Change = class::nativeObject_Change
endwith
*/
// Occurs when the user changes the cell's content.
function nativeObject_Change(Item, ColIndex, NewValue)
	oG2antt = form.EXG2ANTTCHARTACTIVEXCONTROL1.nativeObject
	oG2antt.Refresh()
return

local g1,g2,h,oG2antt,r,var_Column,var_Column1,var_Column2,var_Columns,var_ConditionalFormat,var_ConditionalFormat1,var_ConditionalFormat2,var_ConditionalFormats,var_Items

oG2antt = form.EXG2ANTTCHARTACTIVEXCONTROL1.nativeObject
oG2antt.FreezeEvents(true)
oG2antt.BeginUpdate()
oG2antt.HeaderAppearance = 4
oG2antt.HeaderHeight = 24
oG2antt.LinesAtRoot = -1
var_ConditionalFormats = oG2antt.ConditionalFormats
	var_ConditionalFormat = var_ConditionalFormats.Add("%CE1")
		var_ConditionalFormat.Bold = true
		var_ConditionalFormat.BackColor = 0xf5f5f5
		var_ConditionalFormat.ApplyTo = 1 /*0x1 | */
	var_ConditionalFormat1 = var_ConditionalFormats.Add("%CE2")
		var_ConditionalFormat1.Bold = true
		var_ConditionalFormat1.BackColor = 0xf5f5f5
		var_ConditionalFormat1.ApplyTo = 2 /*0x2 | */
	var_ConditionalFormat2 = var_ConditionalFormats.Add("%CE3")
		var_ConditionalFormat2.Bold = true
		var_ConditionalFormat2.BackColor = 0xf5f5f5
		var_ConditionalFormat2.ApplyTo = 3 /*0x3 | */
var_Columns = oG2antt.Columns
	var_Columns.Add("Description")
	var_Column = var_Columns.Add("Qty")
		var_Column.Editor.EditType = 4
		// var_Column.Def(20) = "sum(current,rec,%1)"
		with (oG2antt)
			TemplateDef = [dim var_Column]
			TemplateDef = var_Column
			Template = [var_Column.Def(20) = "sum(current,rec,%1)"]
		endwith
	var_Column1 = var_Columns.Add("Price")
		// var_Column1.Def(20) = "avg(current,rec,%2)"
		with (oG2antt)
			TemplateDef = [dim var_Column1]
			TemplateDef = var_Column1
			Template = [var_Column1.Def(20) = "avg(current,rec,%2)"]
		endwith
		var_Column1.Editor.EditType = 4
	var_Column2 = var_Columns.Add("Amount")
		var_Column2.ComputedField = "%1 * %2"
		// var_Column2.Def(20) = "sum(current,rec,%3)"
		with (oG2antt)
			TemplateDef = [dim var_Column2]
			TemplateDef = var_Column2
			Template = [var_Column2.Def(20) = "sum(current,rec,%3)"]
		endwith
var_Items = oG2antt.Items
	r = var_Items.AddItem("Root")
	g1 = var_Items.InsertItem(r,null,"Group 1")
	h = var_Items.InsertItem(g1,null,"Item 1")
	// var_Items.CellValue(h,1) = 1
	with (oG2antt)
		TemplateDef = [dim var_Items,h]
		TemplateDef = var_Items
		TemplateDef = h
		Template = [var_Items.CellValue(h,1) = 1]
	endwith
	// var_Items.CellValue(h,2) = 10
	with (oG2antt)
		TemplateDef = [dim var_Items,h]
		TemplateDef = var_Items
		TemplateDef = h
		Template = [var_Items.CellValue(h,2) = 10]
	endwith
	h = var_Items.InsertItem(g1,null,"Item 2")
	// var_Items.CellValue(h,1) = 2
	with (oG2antt)
		TemplateDef = [dim var_Items,h]
		TemplateDef = var_Items
		TemplateDef = h
		Template = [var_Items.CellValue(h,1) = 2]
	endwith
	// var_Items.CellValue(h,2) = 11
	with (oG2antt)
		TemplateDef = [dim var_Items,h]
		TemplateDef = var_Items
		TemplateDef = h
		Template = [var_Items.CellValue(h,2) = 11]
	endwith
	g2 = var_Items.InsertItem(r,null,"Group 2")
	h = var_Items.InsertItem(g2,null,"Item 1")
	// var_Items.CellValue(h,1) = 3
	with (oG2antt)
		TemplateDef = [dim var_Items,h]
		TemplateDef = var_Items
		TemplateDef = h
		Template = [var_Items.CellValue(h,1) = 3]
	endwith
	// var_Items.CellValue(h,2) = 12
	with (oG2antt)
		TemplateDef = [dim var_Items,h]
		TemplateDef = var_Items
		TemplateDef = h
		Template = [var_Items.CellValue(h,2) = 12]
	endwith
	h = var_Items.InsertItem(g2,null,"Item 2")
	// var_Items.CellValue(h,1) = 4
	with (oG2antt)
		TemplateDef = [dim var_Items,h]
		TemplateDef = var_Items
		TemplateDef = h
		Template = [var_Items.CellValue(h,1) = 4]
	endwith
	// var_Items.CellValue(h,2) = 13
	with (oG2antt)
		TemplateDef = [dim var_Items,h]
		TemplateDef = var_Items
		TemplateDef = h
		Template = [var_Items.CellValue(h,2) = 13]
	endwith
	// var_Items.ExpandItem(0) = true
	with (oG2antt)
		TemplateDef = [dim var_Items]
		TemplateDef = var_Items
		Template = [var_Items.ExpandItem(0) = True]
	endwith
oG2antt.EndUpdate()
oG2antt.FreezeEvents(false)
|
|
2325
|
Highlight the total fields
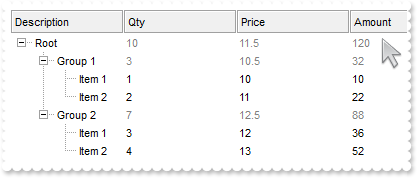
/*
with (this.EXG2ANTTCHARTACTIVEXCONTROL1.nativeObject)
	Change = class::nativeObject_Change
endwith
*/
// Occurs when the user changes the cell's content.
function nativeObject_Change(Item, ColIndex, NewValue)
	oG2antt = form.EXG2ANTTCHARTACTIVEXCONTROL1.nativeObject
	oG2antt.Refresh()
return

local g1,g2,h,oG2antt,r,var_Column,var_Column1,var_Column2,var_Columns,var_ConditionalFormat,var_ConditionalFormat1,var_ConditionalFormat2,var_ConditionalFormats,var_Items

oG2antt = form.EXG2ANTTCHARTACTIVEXCONTROL1.nativeObject
oG2antt.FreezeEvents(true)
oG2antt.BeginUpdate()
oG2antt.HeaderAppearance = 4
oG2antt.HeaderHeight = 24
oG2antt.LinesAtRoot = -1
var_ConditionalFormats = oG2antt.ConditionalFormats
	var_ConditionalFormat = var_ConditionalFormats.Add("%CT1")
		var_ConditionalFormat.ForeColor = 0x808080
		var_ConditionalFormat.ApplyTo = 1 /*0x1 | */
	var_ConditionalFormat1 = var_ConditionalFormats.Add("%CT2")
		var_ConditionalFormat1.ForeColor = 0x808080
		var_ConditionalFormat1.ApplyTo = 2 /*0x2 | */
	var_ConditionalFormat2 = var_ConditionalFormats.Add("%CT3")
		var_ConditionalFormat2.ForeColor = 0x808080
		var_ConditionalFormat2.ApplyTo = 3 /*0x3 | */
var_Columns = oG2antt.Columns
	var_Columns.Add("Description")
	var_Column = var_Columns.Add("Qty")
		var_Column.Editor.EditType = 4
		// var_Column.Def(20) = "sum(current,rec,%1)"
		with (oG2antt)
			TemplateDef = [dim var_Column]
			TemplateDef = var_Column
			Template = [var_Column.Def(20) = "sum(current,rec,%1)"]
		endwith
	var_Column1 = var_Columns.Add("Price")
		// var_Column1.Def(20) = "avg(current,rec,%2)"
		with (oG2antt)
			TemplateDef = [dim var_Column1]
			TemplateDef = var_Column1
			Template = [var_Column1.Def(20) = "avg(current,rec,%2)"]
		endwith
		var_Column1.Editor.EditType = 4
	var_Column2 = var_Columns.Add("Amount")
		var_Column2.ComputedField = "%1 * %2"
		// var_Column2.Def(20) = "sum(current,rec,%3)"
		with (oG2antt)
			TemplateDef = [dim var_Column2]
			TemplateDef = var_Column2
			Template = [var_Column2.Def(20) = "sum(current,rec,%3)"]
		endwith
var_Items = oG2antt.Items
	r = var_Items.AddItem("Root")
	g1 = var_Items.InsertItem(r,null,"Group 1")
	h = var_Items.InsertItem(g1,null,"Item 1")
	// var_Items.CellValue(h,1) = 1
	with (oG2antt)
		TemplateDef = [dim var_Items,h]
		TemplateDef = var_Items
		TemplateDef = h
		Template = [var_Items.CellValue(h,1) = 1]
	endwith
	// var_Items.CellValue(h,2) = 10
	with (oG2antt)
		TemplateDef = [dim var_Items,h]
		TemplateDef = var_Items
		TemplateDef = h
		Template = [var_Items.CellValue(h,2) = 10]
	endwith
	h = var_Items.InsertItem(g1,null,"Item 2")
	// var_Items.CellValue(h,1) = 2
	with (oG2antt)
		TemplateDef = [dim var_Items,h]
		TemplateDef = var_Items
		TemplateDef = h
		Template = [var_Items.CellValue(h,1) = 2]
	endwith
	// var_Items.CellValue(h,2) = 11
	with (oG2antt)
		TemplateDef = [dim var_Items,h]
		TemplateDef = var_Items
		TemplateDef = h
		Template = [var_Items.CellValue(h,2) = 11]
	endwith
	g2 = var_Items.InsertItem(r,null,"Group 2")
	h = var_Items.InsertItem(g2,null,"Item 1")
	// var_Items.CellValue(h,1) = 3
	with (oG2antt)
		TemplateDef = [dim var_Items,h]
		TemplateDef = var_Items
		TemplateDef = h
		Template = [var_Items.CellValue(h,1) = 3]
	endwith
	// var_Items.CellValue(h,2) = 12
	with (oG2antt)
		TemplateDef = [dim var_Items,h]
		TemplateDef = var_Items
		TemplateDef = h
		Template = [var_Items.CellValue(h,2) = 12]
	endwith
	h = var_Items.InsertItem(g2,null,"Item 2")
	// var_Items.CellValue(h,1) = 4
	with (oG2antt)
		TemplateDef = [dim var_Items,h]
		TemplateDef = var_Items
		TemplateDef = h
		Template = [var_Items.CellValue(h,1) = 4]
	endwith
	// var_Items.CellValue(h,2) = 13
	with (oG2antt)
		TemplateDef = [dim var_Items,h]
		TemplateDef = var_Items
		TemplateDef = h
		Template = [var_Items.CellValue(h,2) = 13]
	endwith
	// var_Items.ExpandItem(0) = true
	with (oG2antt)
		TemplateDef = [dim var_Items]
		TemplateDef = var_Items
		Template = [var_Items.ExpandItem(0) = True]
	endwith
oG2antt.EndUpdate()
oG2antt.FreezeEvents(false)
|
|
2324
|
Highlight the leaf items
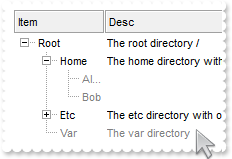
local h,hR,oG2antt,var_Column,var_Columns,var_ConditionalFormat,var_Items

oG2antt = form.EXG2ANTTCHARTACTIVEXCONTROL1.nativeObject
oG2antt.BeginUpdate()
// oG2antt.ConditionalFormats.Add("%CC0=0").ForeColor = 0x808080
var_ConditionalFormat = oG2antt.ConditionalFormats.Add("%CC0=0")
with (oG2antt)
	TemplateDef = [dim var_ConditionalFormat]
	TemplateDef = var_ConditionalFormat
	Template = [var_ConditionalFormat.ForeColor = 8421504]
endwith
oG2antt.HeaderAppearance = 4
oG2antt.HeaderHeight = 24
oG2antt.LinesAtRoot = -1
var_Columns = oG2antt.Columns
	// var_Columns.Add("Item").Width = 16
	var_Column = var_Columns.Add("Item")
	with (oG2antt)
		TemplateDef = [dim var_Column]
		TemplateDef = var_Column
		Template = [var_Column.Width = 16]
	endwith
	var_Columns.Add("Desc")
var_Items = oG2antt.Items
	hR = var_Items.AddItem("Root")
	// var_Items.CellValue(hR,1) = "The root directory /"
	with (oG2antt)
		TemplateDef = [dim var_Items,hR]
		TemplateDef = var_Items
		TemplateDef = hR
		Template = [var_Items.CellValue(hR,1) = "The root directory /"]
	endwith
	// var_Items.ExpandItem(hR) = true
	with (oG2antt)
		TemplateDef = [dim var_Items,hR]
		TemplateDef = var_Items
		TemplateDef = hR
		Template = [var_Items.ExpandItem(hR) = True]
	endwith
	h = var_Items.InsertItem(hR,null,"Home")
	// var_Items.CellValue(h,1) = "The home directory with user directories Alice and Bob"
	with (oG2antt)
		TemplateDef = [dim var_Items,h]
		TemplateDef = var_Items
		TemplateDef = h
		Template = [var_Items.CellValue(h,1) = "The home directory with user directories Alice and Bob"]
	endwith
	var_Items.InsertItem(h,null,"Alice")
	var_Items.InsertItem(h,null,"Bob")
	// var_Items.ExpandItem(h) = true
	with (oG2antt)
		TemplateDef = [dim var_Items,h]
		TemplateDef = var_Items
		TemplateDef = h
		Template = [var_Items.ExpandItem(h) = True]
	endwith
	h = var_Items.InsertItem(hR,null,"Etc")
	// var_Items.CellValue(h,1) = "The etc directory with one configuration file"
	with (oG2antt)
		TemplateDef = [dim var_Items,h]
		TemplateDef = var_Items
		TemplateDef = h
		Template = [var_Items.CellValue(h,1) = "The etc directory with one configuration file"]
	endwith
	h = var_Items.InsertItem(h,null,"nginx.conf")
	// var_Items.CellValue(var_Items.InsertItem(hR,null,"Var"),1) = "The var directory"
	with (oG2antt)
		TemplateDef = [dim var_Items]
		TemplateDef = var_Items
		Template = [var_Items.CellValue(InsertItem(hR,,"Var"),1) = "The var directory"]
	endwith
oG2antt.EndUpdate()
|
|
2323
|
Highlight the parent items
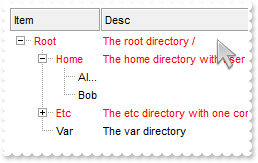
local h,hR,oG2antt,var_Column,var_Columns,var_ConditionalFormat,var_Items

oG2antt = form.EXG2ANTTCHARTACTIVEXCONTROL1.nativeObject
oG2antt.BeginUpdate()
// oG2antt.ConditionalFormats.Add("%CC0").ForeColor = 0xff
var_ConditionalFormat = oG2antt.ConditionalFormats.Add("%CC0")
with (oG2antt)
	TemplateDef = [dim var_ConditionalFormat]
	TemplateDef = var_ConditionalFormat
	Template = [var_ConditionalFormat.ForeColor = 255]
endwith
oG2antt.HeaderAppearance = 4
oG2antt.HeaderHeight = 24
oG2antt.LinesAtRoot = -1
var_Columns = oG2antt.Columns
	// var_Columns.Add("Item").Width = 16
	var_Column = var_Columns.Add("Item")
	with (oG2antt)
		TemplateDef = [dim var_Column]
		TemplateDef = var_Column
		Template = [var_Column.Width = 16]
	endwith
	var_Columns.Add("Desc")
var_Items = oG2antt.Items
	hR = var_Items.AddItem("Root")
	// var_Items.CellValue(hR,1) = "The root directory /"
	with (oG2antt)
		TemplateDef = [dim var_Items,hR]
		TemplateDef = var_Items
		TemplateDef = hR
		Template = [var_Items.CellValue(hR,1) = "The root directory /"]
	endwith
	// var_Items.ExpandItem(hR) = true
	with (oG2antt)
		TemplateDef = [dim var_Items,hR]
		TemplateDef = var_Items
		TemplateDef = hR
		Template = [var_Items.ExpandItem(hR) = True]
	endwith
	h = var_Items.InsertItem(hR,null,"Home")
	// var_Items.CellValue(h,1) = "The home directory with user directories Alice and Bob"
	with (oG2antt)
		TemplateDef = [dim var_Items,h]
		TemplateDef = var_Items
		TemplateDef = h
		Template = [var_Items.CellValue(h,1) = "The home directory with user directories Alice and Bob"]
	endwith
	var_Items.InsertItem(h,null,"Alice")
	var_Items.InsertItem(h,null,"Bob")
	// var_Items.ExpandItem(h) = true
	with (oG2antt)
		TemplateDef = [dim var_Items,h]
		TemplateDef = var_Items
		TemplateDef = h
		Template = [var_Items.ExpandItem(h) = True]
	endwith
	h = var_Items.InsertItem(hR,null,"Etc")
	// var_Items.CellValue(h,1) = "The etc directory with one configuration file"
	with (oG2antt)
		TemplateDef = [dim var_Items,h]
		TemplateDef = var_Items
		TemplateDef = h
		Template = [var_Items.CellValue(h,1) = "The etc directory with one configuration file"]
	endwith
	h = var_Items.InsertItem(h,null,"nginx.conf")
	// var_Items.CellValue(var_Items.InsertItem(hR,null,"Var"),1) = "The var directory"
	with (oG2antt)
		TemplateDef = [dim var_Items]
		TemplateDef = var_Items
		Template = [var_Items.CellValue(InsertItem(hR,,"Var"),1) = "The var directory"]
	endwith
oG2antt.EndUpdate()
|
|
2322
|
Highlight the item being expanded or collapsed
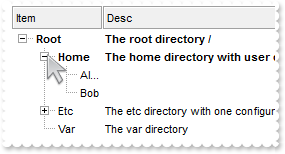
local h,hR,oG2antt,var_Column,var_Columns,var_ConditionalFormat,var_Items

oG2antt = form.EXG2ANTTCHARTACTIVEXCONTROL1.nativeObject
oG2antt.BeginUpdate()
// oG2antt.ConditionalFormats.Add("%CX0").Bold = true
var_ConditionalFormat = oG2antt.ConditionalFormats.Add("%CX0")
with (oG2antt)
	TemplateDef = [dim var_ConditionalFormat]
	TemplateDef = var_ConditionalFormat
	Template = [var_ConditionalFormat.Bold = True]
endwith
oG2antt.HeaderAppearance = 4
oG2antt.HeaderHeight = 24
oG2antt.LinesAtRoot = -1
var_Columns = oG2antt.Columns
	// var_Columns.Add("Item").Width = 16
	var_Column = var_Columns.Add("Item")
	with (oG2antt)
		TemplateDef = [dim var_Column]
		TemplateDef = var_Column
		Template = [var_Column.Width = 16]
	endwith
	var_Columns.Add("Desc")
var_Items = oG2antt.Items
	hR = var_Items.AddItem("Root")
	// var_Items.CellValue(hR,1) = "The root directory /"
	with (oG2antt)
		TemplateDef = [dim var_Items,hR]
		TemplateDef = var_Items
		TemplateDef = hR
		Template = [var_Items.CellValue(hR,1) = "The root directory /"]
	endwith
	// var_Items.ExpandItem(hR) = true
	with (oG2antt)
		TemplateDef = [dim var_Items,hR]
		TemplateDef = var_Items
		TemplateDef = hR
		Template = [var_Items.ExpandItem(hR) = True]
	endwith
	h = var_Items.InsertItem(hR,null,"Home")
	// var_Items.CellValue(h,1) = "The home directory with user directories Alice and Bob"
	with (oG2antt)
		TemplateDef = [dim var_Items,h]
		TemplateDef = var_Items
		TemplateDef = h
		Template = [var_Items.CellValue(h,1) = "The home directory with user directories Alice and Bob"]
	endwith
	var_Items.InsertItem(h,null,"Alice")
	var_Items.InsertItem(h,null,"Bob")
	// var_Items.ExpandItem(h) = true
	with (oG2antt)
		TemplateDef = [dim var_Items,h]
		TemplateDef = var_Items
		TemplateDef = h
		Template = [var_Items.ExpandItem(h) = True]
	endwith
	h = var_Items.InsertItem(hR,null,"Etc")
	// var_Items.CellValue(h,1) = "The etc directory with one configuration file"
	with (oG2antt)
		TemplateDef = [dim var_Items,h]
		TemplateDef = var_Items
		TemplateDef = h
		Template = [var_Items.CellValue(h,1) = "The etc directory with one configuration file"]
	endwith
	h = var_Items.InsertItem(h,null,"nginx.conf")
	// var_Items.CellValue(var_Items.InsertItem(hR,null,"Var"),1) = "The var directory"
	with (oG2antt)
		TemplateDef = [dim var_Items]
		TemplateDef = var_Items
		Template = [var_Items.CellValue(InsertItem(hR,,"Var"),1) = "The var directory"]
	endwith
oG2antt.EndUpdate()
|
|
2321
|
I am using exTotalColumn. Is there an option to exclude specific cells to display the total
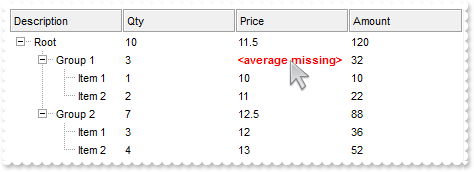
/*
with (this.EXG2ANTTCHARTACTIVEXCONTROL1.nativeObject)
	Change = class::nativeObject_Change
endwith
*/
// Occurs when the user changes the cell's content.
function nativeObject_Change(Item, ColIndex, NewValue)
	oG2antt = form.EXG2ANTTCHARTACTIVEXCONTROL1.nativeObject
	oG2antt.Refresh()
return

local g1,g2,h,oG2antt,r,var_Column,var_Column1,var_Column2,var_Columns,var_Items

oG2antt = form.EXG2ANTTCHARTACTIVEXCONTROL1.nativeObject
oG2antt.FreezeEvents(true)
oG2antt.BeginUpdate()
oG2antt.HeaderAppearance = 4
oG2antt.HeaderHeight = 24
oG2antt.LinesAtRoot = -1
var_Columns = oG2antt.Columns
	var_Columns.Add("Description")
	var_Column = var_Columns.Add("Qty")
		var_Column.Editor.EditType = 4
		// var_Column.Def(20) = "sum(current,rec,%1)"
		with (oG2antt)
			TemplateDef = [dim var_Column]
			TemplateDef = var_Column
			Template = [var_Column.Def(20) = "sum(current,rec,%1)"]
		endwith
	var_Column1 = var_Columns.Add("Price")
		// var_Column1.Def(20) = "avg(current,rec,%2)"
		with (oG2antt)
			TemplateDef = [dim var_Column1]
			TemplateDef = var_Column1
			Template = [var_Column1.Def(20) = "avg(current,rec,%2)"]
		endwith
		var_Column1.Editor.EditType = 4
	var_Column2 = var_Columns.Add("Amount")
		var_Column2.ComputedField = "%1 * %2"
		// var_Column2.Def(20) = "sum(current,rec,%3)"
		with (oG2antt)
			TemplateDef = [dim var_Column2]
			TemplateDef = var_Column2
			Template = [var_Column2.Def(20) = "sum(current,rec,%3)"]
		endwith
var_Items = oG2antt.Items
	r = var_Items.AddItem("Root")
	g1 = var_Items.InsertItem(r,null,"Group 1")
	// var_Items.FormatCell(g1,2) = "`<average missing>`"
	with (oG2antt)
		TemplateDef = [dim var_Items,g1]
		TemplateDef = var_Items
		TemplateDef = g1
		Template = [var_Items.FormatCell(g1,2) = "`<average missing>`"]
	endwith
	// var_Items.CellEditorVisible(g1,2) = false
	with (oG2antt)
		TemplateDef = [dim var_Items,g1]
		TemplateDef = var_Items
		TemplateDef = g1
		Template = [var_Items.CellEditorVisible(g1,2) = False]
	endwith
	// var_Items.CellBold(g1,2) = true
	with (oG2antt)
		TemplateDef = [dim var_Items,g1]
		TemplateDef = var_Items
		TemplateDef = g1
		Template = [var_Items.CellBold(g1,2) = True]
	endwith
	// var_Items.CellForeColor(g1,2) = 0xff
	with (oG2antt)
		TemplateDef = [dim var_Items,g1]
		TemplateDef = var_Items
		TemplateDef = g1
		Template = [var_Items.CellForeColor(g1,2) = 255]
	endwith
	h = var_Items.InsertItem(g1,null,"Item 1")
	// var_Items.CellValue(h,1) = 1
	with (oG2antt)
		TemplateDef = [dim var_Items,h]
		TemplateDef = var_Items
		TemplateDef = h
		Template = [var_Items.CellValue(h,1) = 1]
	endwith
	// var_Items.CellValue(h,2) = 10
	with (oG2antt)
		TemplateDef = [dim var_Items,h]
		TemplateDef = var_Items
		TemplateDef = h
		Template = [var_Items.CellValue(h,2) = 10]
	endwith
	h = var_Items.InsertItem(g1,null,"Item 2")
	// var_Items.CellValue(h,1) = 2
	with (oG2antt)
		TemplateDef = [dim var_Items,h]
		TemplateDef = var_Items
		TemplateDef = h
		Template = [var_Items.CellValue(h,1) = 2]
	endwith
	// var_Items.CellValue(h,2) = 11
	with (oG2antt)
		TemplateDef = [dim var_Items,h]
		TemplateDef = var_Items
		TemplateDef = h
		Template = [var_Items.CellValue(h,2) = 11]
	endwith
	g2 = var_Items.InsertItem(r,null,"Group 2")
	h = var_Items.InsertItem(g2,null,"Item 1")
	// var_Items.CellValue(h,1) = 3
	with (oG2antt)
		TemplateDef = [dim var_Items,h]
		TemplateDef = var_Items
		TemplateDef = h
		Template = [var_Items.CellValue(h,1) = 3]
	endwith
	// var_Items.CellValue(h,2) = 12
	with (oG2antt)
		TemplateDef = [dim var_Items,h]
		TemplateDef = var_Items
		TemplateDef = h
		Template = [var_Items.CellValue(h,2) = 12]
	endwith
	h = var_Items.InsertItem(g2,null,"Item 2")
	// var_Items.CellValue(h,1) = 4
	with (oG2antt)
		TemplateDef = [dim var_Items,h]
		TemplateDef = var_Items
		TemplateDef = h
		Template = [var_Items.CellValue(h,1) = 4]
	endwith
	// var_Items.CellValue(h,2) = 13
	with (oG2antt)
		TemplateDef = [dim var_Items,h]
		TemplateDef = var_Items
		TemplateDef = h
		Template = [var_Items.CellValue(h,2) = 13]
	endwith
	// var_Items.ExpandItem(0) = true
	with (oG2antt)
		TemplateDef = [dim var_Items]
		TemplateDef = var_Items
		Template = [var_Items.ExpandItem(0) = True]
	endwith
oG2antt.EndUpdate()
oG2antt.FreezeEvents(false)
|
|
2320
|
How can I add a total column
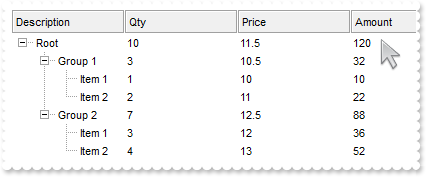
/*
with (this.EXG2ANTTCHARTACTIVEXCONTROL1.nativeObject)
	Change = class::nativeObject_Change
endwith
*/
// Occurs when the user changes the cell's content.
function nativeObject_Change(Item, ColIndex, NewValue)
	oG2antt = form.EXG2ANTTCHARTACTIVEXCONTROL1.nativeObject
	oG2antt.Refresh()
return

local g1,g2,h,oG2antt,r,var_Column,var_Column1,var_Column2,var_Columns,var_Items

oG2antt = form.EXG2ANTTCHARTACTIVEXCONTROL1.nativeObject
oG2antt.FreezeEvents(true)
oG2antt.BeginUpdate()
oG2antt.HeaderAppearance = 4
oG2antt.HeaderHeight = 24
oG2antt.LinesAtRoot = -1
var_Columns = oG2antt.Columns
	var_Columns.Add("Description")
	var_Column = var_Columns.Add("Qty")
		var_Column.Editor.EditType = 4
		// var_Column.Def(20) = "sum(current,rec,%1)"
		with (oG2antt)
			TemplateDef = [dim var_Column]
			TemplateDef = var_Column
			Template = [var_Column.Def(20) = "sum(current,rec,%1)"]
		endwith
	var_Column1 = var_Columns.Add("Price")
		// var_Column1.Def(20) = "avg(current,rec,%2)"
		with (oG2antt)
			TemplateDef = [dim var_Column1]
			TemplateDef = var_Column1
			Template = [var_Column1.Def(20) = "avg(current,rec,%2)"]
		endwith
		var_Column1.Editor.EditType = 4
	var_Column2 = var_Columns.Add("Amount")
		var_Column2.ComputedField = "%1 * %2"
		// var_Column2.Def(20) = "sum(current,rec,%3)"
		with (oG2antt)
			TemplateDef = [dim var_Column2]
			TemplateDef = var_Column2
			Template = [var_Column2.Def(20) = "sum(current,rec,%3)"]
		endwith
var_Items = oG2antt.Items
	r = var_Items.AddItem("Root")
	g1 = var_Items.InsertItem(r,null,"Group 1")
	h = var_Items.InsertItem(g1,null,"Item 1")
	// var_Items.CellValue(h,1) = 1
	with (oG2antt)
		TemplateDef = [dim var_Items,h]
		TemplateDef = var_Items
		TemplateDef = h
		Template = [var_Items.CellValue(h,1) = 1]
	endwith
	// var_Items.CellValue(h,2) = 10
	with (oG2antt)
		TemplateDef = [dim var_Items,h]
		TemplateDef = var_Items
		TemplateDef = h
		Template = [var_Items.CellValue(h,2) = 10]
	endwith
	h = var_Items.InsertItem(g1,null,"Item 2")
	// var_Items.CellValue(h,1) = 2
	with (oG2antt)
		TemplateDef = [dim var_Items,h]
		TemplateDef = var_Items
		TemplateDef = h
		Template = [var_Items.CellValue(h,1) = 2]
	endwith
	// var_Items.CellValue(h,2) = 11
	with (oG2antt)
		TemplateDef = [dim var_Items,h]
		TemplateDef = var_Items
		TemplateDef = h
		Template = [var_Items.CellValue(h,2) = 11]
	endwith
	g2 = var_Items.InsertItem(r,null,"Group 2")
	h = var_Items.InsertItem(g2,null,"Item 1")
	// var_Items.CellValue(h,1) = 3
	with (oG2antt)
		TemplateDef = [dim var_Items,h]
		TemplateDef = var_Items
		TemplateDef = h
		Template = [var_Items.CellValue(h,1) = 3]
	endwith
	// var_Items.CellValue(h,2) = 12
	with (oG2antt)
		TemplateDef = [dim var_Items,h]
		TemplateDef = var_Items
		TemplateDef = h
		Template = [var_Items.CellValue(h,2) = 12]
	endwith
	h = var_Items.InsertItem(g2,null,"Item 2")
	// var_Items.CellValue(h,1) = 4
	with (oG2antt)
		TemplateDef = [dim var_Items,h]
		TemplateDef = var_Items
		TemplateDef = h
		Template = [var_Items.CellValue(h,1) = 4]
	endwith
	// var_Items.CellValue(h,2) = 13
	with (oG2antt)
		TemplateDef = [dim var_Items,h]
		TemplateDef = var_Items
		TemplateDef = h
		Template = [var_Items.CellValue(h,2) = 13]
	endwith
	// var_Items.ExpandItem(0) = true
	with (oG2antt)
		TemplateDef = [dim var_Items]
		TemplateDef = var_Items
		Template = [var_Items.ExpandItem(0) = True]
	endwith
oG2antt.EndUpdate()
oG2antt.FreezeEvents(false)
|
|
2319
|
Is it possible when I move the horizontal scroll bar, that the whole chart scrolls live during move the horizontal scroll bar. Not it scrolls just when I release the left mouse, not during change the horizontal scroll position
local oG2antt,var_Chart

oG2antt = form.EXG2ANTTCHARTACTIVEXCONTROL1.nativeObject
var_Chart = oG2antt.Chart
	// var_Chart.PaneWidth(false) = 0
	with (oG2antt)
		TemplateDef = [dim var_Chart]
		TemplateDef = var_Chart
		Template = [var_Chart.PaneWidth(False) = 0]
	endwith
	var_Chart.LevelCount = 2
	var_Chart.ToolTip = ""
|
|
2318
|
The exLinkStyle is not valid (the style of the link is still solid) if the link's width is greater than 1. What can be done
local h1,h2,h3,oG2antt,var_Chart,var_Items

oG2antt = form.EXG2ANTTCHARTACTIVEXCONTROL1.nativeObject
oG2antt.BeginUpdate()
oG2antt.Columns.Add("Task")
var_Chart = oG2antt.Chart
	var_Chart.FirstVisibleDate = "01/01/2001"
	// var_Chart.PaneWidth(false) = 128
	with (oG2antt)
		TemplateDef = [dim var_Chart]
		TemplateDef = var_Chart
		Template = [var_Chart.PaneWidth(False) = 128]
	endwith
oG2antt.AntiAliasing = true
var_Items = oG2antt.Items
	h1 = var_Items.AddItem("Task 1")
	var_Items.AddBar(h1,"Task","01/02/2001","01/04/2001","K1")
	h2 = var_Items.AddItem("Task 2")
	var_Items.AddBar(h2,"Task","01/05/2001","01/07/2001","K2")
	var_Items.AddLink("L1",h1,"K1",h2,"K2")
	// var_Items.Link("L1",9) = 2
	with (oG2antt)
		TemplateDef = [dim var_Items]
		TemplateDef = var_Items
		Template = [var_Items.Link("L1",9) = 2]
	endwith
	// var_Items.Link("L1",10) = 2
	with (oG2antt)
		TemplateDef = [dim var_Items]
		TemplateDef = var_Items
		Template = [var_Items.Link("L1",10) = 2]
	endwith
	h3 = var_Items.AddItem("Task 4")
	var_Items.AddBar(h3,"Task","01/08/2001","01/10/2001","K3")
	var_Items.AddLink("L2",h2,"K2",h3,"K3")
	// var_Items.Link("L2",9) = 1
	with (oG2antt)
		TemplateDef = [dim var_Items]
		TemplateDef = var_Items
		Template = [var_Items.Link("L2",9) = 1]
	endwith
	// var_Items.Link("L2",10) = 2
	with (oG2antt)
		TemplateDef = [dim var_Items]
		TemplateDef = var_Items
		Template = [var_Items.Link("L2",10) = 2]
	endwith
oG2antt.EndUpdate()
|
|
2317
|
How can I change the tooltip's margins (method 2)
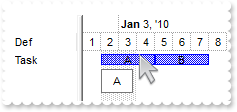
/*
with (this.EXG2ANTTCHARTACTIVEXCONTROL1.nativeObject)
	MouseMove = class::nativeObject_MouseMove
endwith
*/
// Occurs when the user moves the mouse.
function nativeObject_MouseMove(Button, Shift, X, Y)
	oG2antt = form.EXG2ANTTCHARTACTIVEXCONTROL1.nativeObject
	oG2antt.ShowToolTip(oG2antt.Chart.BarFromPoint(-1,-1))
return

local h,oG2antt,var_Bars,var_Chart,var_Items

oG2antt = form.EXG2ANTTCHARTACTIVEXCONTROL1.nativeObject
oG2antt.BeginUpdate()
oG2antt.ToolTipMargin = "16,8"
oG2antt.Columns.Add("Def")
var_Chart = oG2antt.Chart
	var_Chart.AllowCreateBar = 0
	// var_Chart.PaneWidth(false) = 64
	with (oG2antt)
		TemplateDef = [dim var_Chart]
		TemplateDef = var_Chart
		Template = [var_Chart.PaneWidth(False) = 64]
	endwith
	var_Chart.LevelCount = 2
	var_Chart.FirstVisibleDate = "01/01/2010"
	// var_Chart.Bars.Item("Task").Def(6) = "..."
	var_Bars = var_Chart.Bars.Item("Task")
	with (oG2antt)
		TemplateDef = [dim var_Bars]
		TemplateDef = var_Bars
		Template = [var_Bars.Def(6) = "..."]
	endwith
var_Items = oG2antt.Items
	h = var_Items.AddItem("Task")
	var_Items.AddBar(h,"Task","01/02/2010","01/05/2010","A","A")
	var_Items.AddBar(h,"Task","01/05/2010","01/08/2010","B","B")
oG2antt.EndUpdate()
|
|
2316
|
Are there any properties to set text margins at tooltip, like Margins="5,5" (method 1). Margins is used to get some space between text and the tooltips border
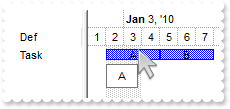
/*
with (this.EXG2ANTTCHARTACTIVEXCONTROL1.nativeObject)
	MouseMove = class::nativeObject_MouseMove
endwith
*/
// Occurs when the user moves the mouse.
function nativeObject_MouseMove(Button, Shift, X, Y)
	oG2antt = form.EXG2ANTTCHARTACTIVEXCONTROL1.nativeObject
	oG2antt.ShowToolTip(oG2antt.Chart.BarFromPoint(-1,-1))
return

local h,oG2antt,var_Bars,var_Chart,var_Items

oG2antt = form.EXG2ANTTCHARTACTIVEXCONTROL1.nativeObject
oG2antt.BeginUpdate()
oG2antt.ToolTipMargin = "16,8"
oG2antt.Columns.Add("Def")
var_Chart = oG2antt.Chart
	var_Chart.AllowCreateBar = 0
	// var_Chart.PaneWidth(false) = 64
	with (oG2antt)
		TemplateDef = [dim var_Chart]
		TemplateDef = var_Chart
		Template = [var_Chart.PaneWidth(False) = 64]
	endwith
	var_Chart.LevelCount = 2
	var_Chart.FirstVisibleDate = "01/01/2010"
	// var_Chart.Bars.Item("Task").Def(6) = "..."
	var_Bars = var_Chart.Bars.Item("Task")
	with (oG2antt)
		TemplateDef = [dim var_Bars]
		TemplateDef = var_Bars
		Template = [var_Bars.Def(6) = "..."]
	endwith
var_Items = oG2antt.Items
	h = var_Items.AddItem("Task")
	var_Items.AddBar(h,"Task","01/02/2010","01/05/2010","A","A")
	var_Items.AddBar(h,"Task","01/05/2010","01/08/2010","B","B")
oG2antt.EndUpdate()
|
|
2315
|
exShowExtendedLinks
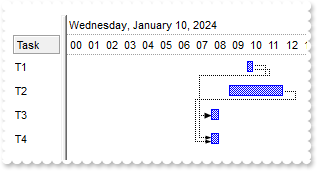
local oG2antt,var_Chart,var_Items,var_Level

oG2antt = form.EXG2ANTTCHARTACTIVEXCONTROL1.nativeObject
oG2antt.BeginUpdate()
oG2antt.DefaultItemHeight = 24
oG2antt.HeaderHeight = 20
oG2antt.HeaderAppearance = 4
oG2antt.AntiAliasing = true
oG2antt.Columns.Add("Task")
var_Chart = oG2antt.Chart
	// var_Chart.PaneWidth(false) = 48
	with (oG2antt)
		TemplateDef = [dim var_Chart]
		TemplateDef = var_Chart
		Template = [var_Chart.PaneWidth(False) = 48]
	endwith
	var_Chart.LevelCount = 2
	var_Chart.UnitScale = 65536
	var_Chart.FirstVisibleDate = "01/10/2024"
	var_Level = var_Chart.Level(1)
		var_Level.DrawTickLines = 0
		var_Level.DrawTickLinesFrom(0,1)
	var_Chart.AllowResizeChart = -1 /*0xfffffef9 | exAllowChangeUnitScale | exAllowResizeChartMiddle | exAllowResizeChartHeader*/
	var_Chart.ShowLinks = 1
var_Items = oG2antt.Items
	var_Items.AddBar(var_Items.AddItem("T1"),"Task","01/10/2024 10:00:00","01/10/2024 10:20:00","T1")
	var_Items.AddBar(var_Items.AddItem("T2"),"Task","01/10/2024 09:00:00","01/10/2024 12:00:00","T2")
	var_Items.AddBar(var_Items.AddItem("T3"),"Task","01/10/2024 08:00:00","01/10/2024 08:30:00","T3")
	var_Items.AddBar(var_Items.AddItem("T4"),"Task","01/10/2024 08:00:00","01/10/2024 08:30:00","T4")
	var_Items.AddLink("L13",var_Items.ItemByIndex(0),"T1",var_Items.ItemByIndex(2),"T3")
	var_Items.AddLink("L14",var_Items.ItemByIndex(0),"T1",var_Items.ItemByIndex(3),"T4")
	var_Items.AddLink("L24",var_Items.ItemByIndex(1),"T2",var_Items.ItemByIndex(3),"T4")
oG2antt.EndUpdate()
|
|
2314
|
According to the documentation of the ShowExtendedLinksEnum value exShowExtendedLinks (1) it is possible to distinctly visualise links (rather than showing them one over another) when two or more links start or end on the same bar
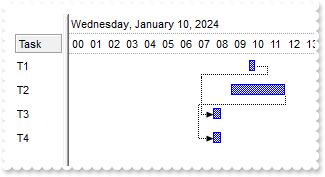
local oG2antt,var_Chart,var_Items,var_Level

oG2antt = form.EXG2ANTTCHARTACTIVEXCONTROL1.nativeObject
oG2antt.BeginUpdate()
oG2antt.DefaultItemHeight = 24
oG2antt.HeaderHeight = 20
oG2antt.HeaderAppearance = 4
oG2antt.AntiAliasing = true
oG2antt.Columns.Add("Task")
var_Chart = oG2antt.Chart
	// var_Chart.PaneWidth(false) = 48
	with (oG2antt)
		TemplateDef = [dim var_Chart]
		TemplateDef = var_Chart
		Template = [var_Chart.PaneWidth(False) = 48]
	endwith
	var_Chart.LevelCount = 2
	var_Chart.UnitScale = 65536
	var_Chart.FirstVisibleDate = "01/10/2024"
	var_Level = var_Chart.Level(1)
		var_Level.DrawTickLines = 0
		var_Level.DrawTickLinesFrom(0,1)
	var_Chart.AllowResizeChart = -1 /*0xfffffef9 | exAllowChangeUnitScale | exAllowResizeChartMiddle | exAllowResizeChartHeader*/
var_Items = oG2antt.Items
	var_Items.AddBar(var_Items.AddItem("T1"),"Task","01/10/2024 10:00:00","01/10/2024 10:20:00","T1")
	var_Items.AddBar(var_Items.AddItem("T2"),"Task","01/10/2024 09:00:00","01/10/2024 12:00:00","T2")
	var_Items.AddBar(var_Items.AddItem("T3"),"Task","01/10/2024 08:00:00","01/10/2024 08:30:00","T3")
	var_Items.AddBar(var_Items.AddItem("T4"),"Task","01/10/2024 08:00:00","01/10/2024 08:30:00","T4")
	var_Items.AddLink("L1",var_Items.ItemByIndex(0),"T1",var_Items.ItemByIndex(2),"T3")
	var_Items.AddLink("L2",var_Items.ItemByIndex(1),"T2",var_Items.ItemByIndex(3),"T4")
	// var_Items.Link("L2",15) = 4
	with (oG2antt)
		TemplateDef = [dim var_Items]
		TemplateDef = var_Items
		Template = [var_Items.Link("L2",15) = 4]
	endwith
oG2antt.EndUpdate()
|
|
2313
|
How to use arrows key left/right to move the cursor left/right inside the text
local oG2antt,var_Editor,var_Items

oG2antt = form.EXG2ANTTCHARTACTIVEXCONTROL1.nativeObject
oG2antt.BeginUpdate()
var_Editor = oG2antt.Columns.Add("Edit").Editor
	var_Editor.EditType = 1
	// var_Editor.Option(20) = false
	with (oG2antt)
		TemplateDef = [dim var_Editor]
		TemplateDef = var_Editor
		Template = [var_Editor.Option(20) = False]
	endwith
	// var_Editor.Option(21) = false
	with (oG2antt)
		TemplateDef = [dim var_Editor]
		TemplateDef = var_Editor
		Template = [var_Editor.Option(21) = False]
	endwith
var_Items = oG2antt.Items
	var_Items.AddItem("000")
	var_Items.AddItem("111")
	var_Items.AddItem("222")
oG2antt.EndUpdate()
|
|
2312
|
How can I force the cursor to jump to the end of the editor once the user clicks the cell
local oG2antt,var_Editor,var_Items

oG2antt = form.EXG2ANTTCHARTACTIVEXCONTROL1.nativeObject
oG2antt.BeginUpdate()
oG2antt.SelBackColor = oG2antt.BackColor
oG2antt.SelForeColor = oG2antt.ForeColor
var_Editor = oG2antt.Columns.Add("Edit").Editor
	var_Editor.EditType = 1
	// var_Editor.Option(48) = -1
	with (oG2antt)
		TemplateDef = [dim var_Editor]
		TemplateDef = var_Editor
		Template = [var_Editor.Option(48) = -1]
	endwith
var_Items = oG2antt.Items
	var_Items.AddItem("000")
	var_Items.AddItem("111")
	var_Items.AddItem("222")
oG2antt.EndUpdate()
|
|
2311
|
How can I show the overview with a different color except or outside the selection
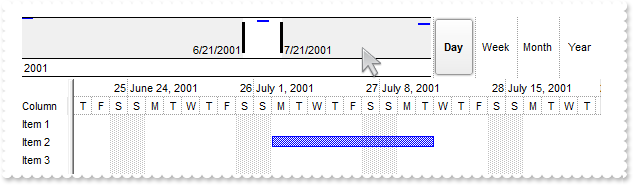
local oG2antt,var_Chart,var_Items

oG2antt = form.EXG2ANTTCHARTACTIVEXCONTROL1.nativeObject
oG2antt.BeginUpdate()
oG2antt.VisualAppearance.Add(1,"gBFLBCJwBAEHhEJAAEhABVIDg6AADACAxRDAMgBQKAAzAJBIYhiGgcYCgMZBSDeCYXABCEYRXBIZQ7BKNIxjSJwFgmEgADE2YAoJDUN4nDKMMDybBkRxtDCPIDnGQoDiGI4nSbKIzSCKMQhrEKZZrnaLJFgOTY8ABLEBvfSgASof6MKBlKhKGoiUo2SCFEaBTBNHxDL6raqqWJ5HDINQlWzbcjjKKFYRbOqTZDkGj4XqKTo3YBAdZSXJsXwTGKkji3ZgMOR3HaQaTjOgINpuDZdRzkUYZUDFSwSDqQIRtCpbJqzFZDZbLNbYBYME47AayID0CbdCgmaalSZHNxbVa0BzpXrFLw1TLoDy8AJ+ABseKzfo9PxdIygZRzKJ8aofE+YxynIfJcC8QgbCmL5eiEPIKH6RABlibJpicW4/FcAx/HOYRGmud4+CcHxdmiDhkGEIIIEkQJSGMHQHFGSBlFEUITEmewAAQIQ2AYRpDGQJAoEIXhXCkCB5kmSAdmgVZPmgZJ8gaT4oHSeIHk8aIEnWCJiEiFgmgmYoIiYJIIE8aB8niB0pmyfIGE+ZYmDQPpjgOUg6DqY5DgYPg2mQAxqEKEJkEkFhGhGZIJA4QA2mOY4GDwOsumCe4NAACJKDoPQOFkZJThaSoZHSGYXmYCYGGKGJmEmFhmCsJoDFYag5iaSISDIAAjAkPJLhyS4JlYbA5iSeZmHqHpnkmdh+hOZx5lSOAzGgSQ+DAAAimkNIkiKTh6DSbIjmkChGhKJ" ;
	 +"JpEoVoWiSaJThyKImmSWI4ACCwNkqBhgDsahKhaJopmqComiqKpqkqEhghKYpAAIJIQmYA46jaLZrgqZo6i6a5KnaPotiZRQkiyIg6lIXw7myCwmkqMpsksNpOjObQLCKQYQiwOpOEKGAPAsZpajabZLHaXo3m4C4GlmNJNisVpFjWZZzkaao6m6S42m6O5vAuRpyjqLhLhidYxgmE5KnqPpvkudp+j+cAMAcAo+i8WIOkSPZuguZwDkKcJMDafpBE8XAengPJxEwVwWkWcYMGcGpGnGTBTBCRIwhkXwikichMhcJpJnKDIPB+NYNimAgqkucwMkcMoInKO4fC2F5ikyZw6k6c5MncPpPnOLJXAiTZJhOXxGlGdINCcSpSnSTQ3E6UY0CuYgulSdRNFcVpVnWDRnFSVBwh0axeledgNFsXJRA+HYXGaWZ2g2JxqlqdpNjcZZYmYCJDHKXJ3E2K4doux3gbE8OEF4ygtjuH6L8eAHAHgFGCO8bY2QZgZDiBwJ4FRijxE4G8DoxBxj6B6EINwTADjvBaMseYHBng1GaPMTg7wepxA4J4Rx8RjgfCYFMeoEQ6BpGqPUTob2MD2A6IQLoNAKiHAuG0WYAAJCVBCCETAHR3DMFWPgDwD29j4E8CoV4sw7imAIIcJASggAHBeBIJw5grikCmHoSYNxWjrH2BMAoNgqAZE8O0GYEg5DgAIG8DgxwjhXGaCYZIcgnxBGSDILgmwTjKHkJMNwqgjCREoGEC4RRMifHqJc" &
	 +"YokQ6BgEYJEUIaQOhlHIIESAECAg=")
oG2antt.BackColorLevelHeader = oG2antt.BackColor
oG2antt.Template = [Background(199) = 1] // oG2antt.Background(199) = 0x1
oG2antt.Template = [Background(200) = 15790320] // oG2antt.Background(200) = 0xf0f0f0
oG2antt.Chart.OverviewSelBackColor = 0xffffff
oG2antt.Template = [Background(201) = 16777216] // oG2antt.Background(201) = 0x1000000
var_Chart = oG2antt.Chart
	var_Chart.FirstVisibleDate = "06/21/2001"
	// var_Chart.PaneWidth(false) = 48
	with (oG2antt)
		TemplateDef = [dim var_Chart]
		TemplateDef = var_Chart
		Template = [var_Chart.PaneWidth(False) = 48]
	endwith
	var_Chart.OverviewVisible = 31746 /*0x400 | exOverviewShowSelMargins | exOverviewShowMargins | exOverviewShowDateTimeScaleBottom | exOverviewShowAllVisible*/
	var_Chart.OverviewHeight = 64
	var_Chart.LevelCount = 2
	var_Chart.UnitScale = 4096
	// var_Chart.Label(65536) = ""
	with (oG2antt)
		TemplateDef = [dim var_Chart]
		TemplateDef = var_Chart
		Template = [var_Chart.Label(65536) = ""]
	endwith
	// var_Chart.Label(1048576) = ""
	with (oG2antt)
		TemplateDef = [dim var_Chart]
		TemplateDef = var_Chart
		Template = [var_Chart.Label(1048576) = ""]
	endwith
	// var_Chart.Label(16777216) = ""
	with (oG2antt)
		TemplateDef = [dim var_Chart]
		TemplateDef = var_Chart
		Template = [var_Chart.Label(16777216) = ""]
	endwith
	var_Chart.AllowOverviewZoom = 1
oG2antt.Columns.Add("Column")
var_Items = oG2antt.Items
	var_Items.AddBar(var_Items.AddItem("Item 1"),"Task","01/02/2001","01/11/2001")
	var_Items.AddBar(var_Items.AddItem("Item 2"),"Task","07/02/2001","07/11/2001")
	var_Items.AddBar(var_Items.AddItem("Item 3"),"Task","11/02/2001","11/11/2001")
oG2antt.EndUpdate()
|
|
2310
|
Resize the chart using the overview's selection left and right margins (blue)
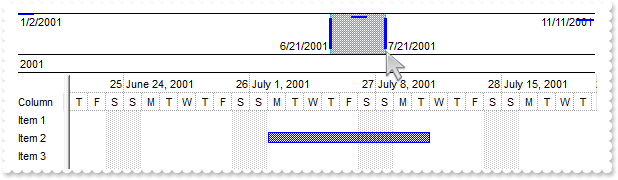
local oG2antt,var_Chart,var_Items

oG2antt = form.EXG2ANTTCHARTACTIVEXCONTROL1.nativeObject
oG2antt.BeginUpdate()
oG2antt.BackColorLevelHeader = oG2antt.BackColor
oG2antt.Template = [Background(199) = 16711680] // oG2antt.Background(199) = 0xff0000
var_Chart = oG2antt.Chart
	var_Chart.FirstVisibleDate = "06/21/2001"
	// var_Chart.PaneWidth(false) = 48
	with (oG2antt)
		TemplateDef = [dim var_Chart]
		TemplateDef = var_Chart
		Template = [var_Chart.PaneWidth(False) = 48]
	endwith
	var_Chart.OverviewVisible = 31746 /*0x400 | exOverviewShowSelMargins | exOverviewShowMargins | exOverviewShowDateTimeScaleBottom | exOverviewShowAllVisible*/
	var_Chart.OverviewHeight = 64
	var_Chart.LevelCount = 2
	var_Chart.UnitScale = 4096
oG2antt.Columns.Add("Column")
var_Items = oG2antt.Items
	var_Items.AddBar(var_Items.AddItem("Item 1"),"Task","01/02/2001","01/11/2001")
	var_Items.AddBar(var_Items.AddItem("Item 2"),"Task","07/02/2001","07/11/2001")
	var_Items.AddBar(var_Items.AddItem("Item 3"),"Task","11/02/2001","11/11/2001")
oG2antt.EndUpdate()
|
|
2309
|
Resize the chart using the overview's selection left and right margins (black)
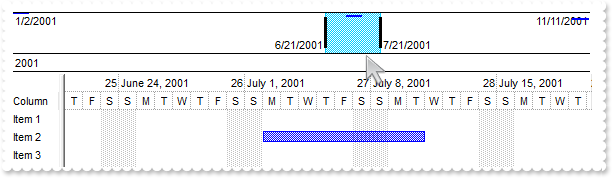
local oG2antt,var_Chart,var_Items

oG2antt = form.EXG2ANTTCHARTACTIVEXCONTROL1.nativeObject
oG2antt.BeginUpdate()
oG2antt.BackColorLevelHeader = oG2antt.BackColor
oG2antt.Template = [Background(199) = 1] // oG2antt.Background(199) = 0x1
var_Chart = oG2antt.Chart
	var_Chart.FirstVisibleDate = "06/21/2001"
	// var_Chart.PaneWidth(false) = 48
	with (oG2antt)
		TemplateDef = [dim var_Chart]
		TemplateDef = var_Chart
		Template = [var_Chart.PaneWidth(False) = 48]
	endwith
	var_Chart.OverviewVisible = 31746 /*0x400 | exOverviewShowSelMargins | exOverviewShowMargins | exOverviewShowDateTimeScaleBottom | exOverviewShowAllVisible*/
	var_Chart.OverviewHeight = 64
	var_Chart.LevelCount = 2
	var_Chart.UnitScale = 4096
oG2antt.Columns.Add("Column")
var_Items = oG2antt.Items
	var_Items.AddBar(var_Items.AddItem("Item 1"),"Task","01/02/2001","01/11/2001")
	var_Items.AddBar(var_Items.AddItem("Item 2"),"Task","07/02/2001","07/11/2001")
	var_Items.AddBar(var_Items.AddItem("Item 3"),"Task","11/02/2001","11/11/2001")
oG2antt.EndUpdate()
|
|
2308
|
Disable temporarily the column's sort, resize and drag and drop
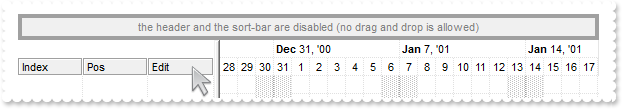
local oG2antt,var_Chart,var_Column,var_Column1,var_Editor,var_Level

oG2antt = form.EXG2ANTTCHARTACTIVEXCONTROL1.nativeObject
oG2antt.BeginUpdate()
oG2antt.OnResizeControl = 1
oG2antt.SortBarVisible = true
oG2antt.SortBarCaption = "<fgcolor 808080><c>the header and the sort-bar are disabled (no drag and drop is allowed)"
oG2antt.AllowGroupBy = true
oG2antt.HeaderEnabled = false
oG2antt.HeaderAppearance = 4
// oG2antt.Columns.Add("Index").FormatColumn = "1 index ``"
var_Column = oG2antt.Columns.Add("Index")
with (oG2antt)
	TemplateDef = [dim var_Column]
	TemplateDef = var_Column
	Template = [var_Column.FormatColumn = "1 index ``"]
endwith
// oG2antt.Columns.Add("Pos").FormatColumn = "1 apos ``"
var_Column1 = oG2antt.Columns.Add("Pos")
with (oG2antt)
	TemplateDef = [dim var_Column1]
	TemplateDef = var_Column1
	Template = [var_Column1.FormatColumn = "1 apos ``"]
endwith
// oG2antt.Columns.Add("Edit").Editor.EditType = 1
var_Editor = oG2antt.Columns.Add("Edit").Editor
with (oG2antt)
	TemplateDef = [dim var_Editor]
	TemplateDef = var_Editor
	Template = [var_Editor.EditType = 1]
endwith
oG2antt.GridLineStyle = 512
oG2antt.DrawGridLines = 2
oG2antt.GridLineColor = 0xe0e0e0
var_Chart = oG2antt.Chart
	var_Chart.AllowCreateBar = 1
	var_Chart.LevelCount = 2
	var_Chart.FirstVisibleDate = "12/28/2000"
	// var_Chart.PaneWidth(false) = 196
	with (oG2antt)
		TemplateDef = [dim var_Chart]
		TemplateDef = var_Chart
		Template = [var_Chart.PaneWidth(False) = 196]
	endwith
	var_Chart.GridLineStyle = 512
	var_Chart.DrawGridLines = -1
	var_Level = var_Chart.Level(1)
		var_Level.DrawGridLines = true
		var_Level.GridLineColor = oG2antt.GridLineColor
oG2antt.EndUpdate()
|
|
2307
|
Adds a Finish-Start(FS) link (method 3)
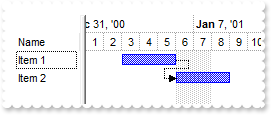
local h1,h2,oG2antt,var_Chart,var_Items

oG2antt = form.EXG2ANTTCHARTACTIVEXCONTROL1.nativeObject
oG2antt.BeginUpdate()
oG2antt.Columns.Add("Name")
var_Chart = oG2antt.Chart
	var_Chart.LevelCount = 2
	var_Chart.FirstVisibleDate = "12/28/2000"
	// var_Chart.PaneWidth(false) = 64
	with (oG2antt)
		TemplateDef = [dim var_Chart]
		TemplateDef = var_Chart
		Template = [var_Chart.PaneWidth(False) = 64]
	endwith
var_Items = oG2antt.Items
	h1 = var_Items.AddItem("Item 1")
	var_Items.AddBar(h1,"Task","01/03/2001","01/06/2001")
	h2 = var_Items.AddItem("Item 2")
	var_Items.AddBar(h2,"Task","01/03/2001","01/06/2001")
	var_Items.AddLink("Link1",h1,"",h2,"")
	var_Items.SchedulePDM(0,"")
oG2antt.EndUpdate()
|
|
2306
|
Adds a Start-Start(SS) link (method 3)
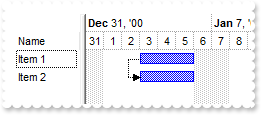
local h1,h2,oG2antt,var_Chart,var_Items

oG2antt = form.EXG2ANTTCHARTACTIVEXCONTROL1.nativeObject
oG2antt.BeginUpdate()
oG2antt.Columns.Add("Name")
var_Chart = oG2antt.Chart
	var_Chart.LevelCount = 2
	var_Chart.FirstVisibleDate = "12/28/2000"
	// var_Chart.PaneWidth(false) = 64
	with (oG2antt)
		TemplateDef = [dim var_Chart]
		TemplateDef = var_Chart
		Template = [var_Chart.PaneWidth(False) = 64]
	endwith
var_Items = oG2antt.Items
	h1 = var_Items.AddItem("Item 1")
	var_Items.AddBar(h1,"Task","01/03/2001","01/06/2001")
	h2 = var_Items.AddItem("Item 2")
	var_Items.AddBar(h2,"Task","01/03/2001","01/06/2001")
	var_Items.AddLink("Link1",h1,"",h2,"")
	// var_Items.Link("Link1",6) = 0
	with (oG2antt)
		TemplateDef = [dim var_Items]
		TemplateDef = var_Items
		Template = [var_Items.Link("Link1",6) = 0]
	endwith
	// var_Items.Link("Link1",7) = 0
	with (oG2antt)
		TemplateDef = [dim var_Items]
		TemplateDef = var_Items
		Template = [var_Items.Link("Link1",7) = 0]
	endwith
	var_Items.SchedulePDM(0,"")
oG2antt.EndUpdate()
|
|
2305
|
Adds a Finish-Finish(FF) link (method 3)
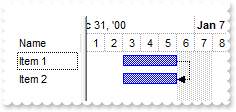
local h1,h2,oG2antt,var_Chart,var_Items

oG2antt = form.EXG2ANTTCHARTACTIVEXCONTROL1.nativeObject
oG2antt.BeginUpdate()
oG2antt.Columns.Add("Name")
var_Chart = oG2antt.Chart
	var_Chart.LevelCount = 2
	var_Chart.FirstVisibleDate = "12/28/2000"
	// var_Chart.PaneWidth(false) = 64
	with (oG2antt)
		TemplateDef = [dim var_Chart]
		TemplateDef = var_Chart
		Template = [var_Chart.PaneWidth(False) = 64]
	endwith
var_Items = oG2antt.Items
	h1 = var_Items.AddItem("Item 1")
	var_Items.AddBar(h1,"Task","01/03/2001","01/06/2001")
	h2 = var_Items.AddItem("Item 2")
	var_Items.AddBar(h2,"Task","01/03/2001","01/06/2001")
	var_Items.AddLink("Link1",h1,"",h2,"")
	// var_Items.Link("Link1",6) = 2
	with (oG2antt)
		TemplateDef = [dim var_Items]
		TemplateDef = var_Items
		Template = [var_Items.Link("Link1",6) = 2]
	endwith
	// var_Items.Link("Link1",7) = 2
	with (oG2antt)
		TemplateDef = [dim var_Items]
		TemplateDef = var_Items
		Template = [var_Items.Link("Link1",7) = 2]
	endwith
	var_Items.SchedulePDM(0,"")
oG2antt.EndUpdate()
|
|
2304
|
Adds a Start-Finish(SF) link (method 3)
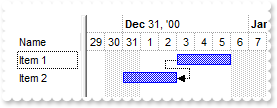
local h1,h2,oG2antt,var_Chart,var_Items

oG2antt = form.EXG2ANTTCHARTACTIVEXCONTROL1.nativeObject
oG2antt.BeginUpdate()
oG2antt.Columns.Add("Name")
var_Chart = oG2antt.Chart
	var_Chart.LevelCount = 2
	var_Chart.FirstVisibleDate = "12/28/2000"
	// var_Chart.PaneWidth(false) = 64
	with (oG2antt)
		TemplateDef = [dim var_Chart]
		TemplateDef = var_Chart
		Template = [var_Chart.PaneWidth(False) = 64]
	endwith
var_Items = oG2antt.Items
	h1 = var_Items.AddItem("Item 1")
	var_Items.AddBar(h1,"Task","01/03/2001","01/06/2001")
	h2 = var_Items.AddItem("Item 2")
	var_Items.AddBar(h2,"Task","01/03/2001","01/06/2001")
	var_Items.AddLink("Link1",h1,"",h2,"")
	// var_Items.Link("Link1",6) = 0
	with (oG2antt)
		TemplateDef = [dim var_Items]
		TemplateDef = var_Items
		Template = [var_Items.Link("Link1",6) = 0]
	endwith
	// var_Items.Link("Link1",7) = 2
	with (oG2antt)
		TemplateDef = [dim var_Items]
		TemplateDef = var_Items
		Template = [var_Items.Link("Link1",7) = 2]
	endwith
	var_Items.SchedulePDM(0,"")
oG2antt.EndUpdate()
|
|
2303
|
Adds a Finish-Start(FS) link (method 2)
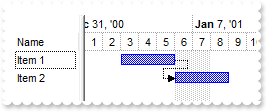
local h1,h2,oG2antt,var_Chart,var_Items

oG2antt = form.EXG2ANTTCHARTACTIVEXCONTROL1.nativeObject
oG2antt.BeginUpdate()
oG2antt.Columns.Add("Name")
var_Chart = oG2antt.Chart
	var_Chart.LevelCount = 2
	var_Chart.FirstVisibleDate = "12/28/2000"
	// var_Chart.PaneWidth(false) = 64
	with (oG2antt)
		TemplateDef = [dim var_Chart]
		TemplateDef = var_Chart
		Template = [var_Chart.PaneWidth(False) = 64]
	endwith
var_Items = oG2antt.Items
	h1 = var_Items.AddItem("Item 1")
	var_Items.AddBar(h1,"Task","01/03/2001","01/06/2001")
	h2 = var_Items.AddItem("Item 2")
	var_Items.AddBar(h2,"Task","01/03/2001","01/06/2001")
	// var_Items.ItemBar(h2,"",270) = "1FS"
	with (oG2antt)
		TemplateDef = [dim var_Items,h2]
		TemplateDef = var_Items
		TemplateDef = h2
		Template = [var_Items.ItemBar(h2,"",270) = "1FS"]
	endwith
	var_Items.SchedulePDM(0,"")
oG2antt.EndUpdate()
|
|
2302
|
Adds a Start-Start(SS) link (method 2)
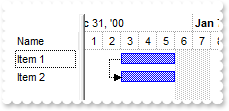
local h1,h2,oG2antt,var_Chart,var_Items

oG2antt = form.EXG2ANTTCHARTACTIVEXCONTROL1.nativeObject
oG2antt.BeginUpdate()
oG2antt.Columns.Add("Name")
var_Chart = oG2antt.Chart
	var_Chart.LevelCount = 2
	var_Chart.FirstVisibleDate = "12/28/2000"
	// var_Chart.PaneWidth(false) = 64
	with (oG2antt)
		TemplateDef = [dim var_Chart]
		TemplateDef = var_Chart
		Template = [var_Chart.PaneWidth(False) = 64]
	endwith
var_Items = oG2antt.Items
	h1 = var_Items.AddItem("Item 1")
	var_Items.AddBar(h1,"Task","01/03/2001","01/06/2001")
	h2 = var_Items.AddItem("Item 2")
	var_Items.AddBar(h2,"Task","01/03/2001","01/06/2001")
	// var_Items.ItemBar(h2,"",270) = "1SS"
	with (oG2antt)
		TemplateDef = [dim var_Items,h2]
		TemplateDef = var_Items
		TemplateDef = h2
		Template = [var_Items.ItemBar(h2,"",270) = "1SS"]
	endwith
	var_Items.SchedulePDM(0,"")
oG2antt.EndUpdate()
|
|
2301
|
Adds a Finish-Finish(FF) link (method 2)
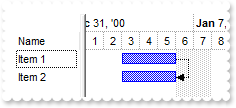
local h1,h2,oG2antt,var_Chart,var_Items

oG2antt = form.EXG2ANTTCHARTACTIVEXCONTROL1.nativeObject
oG2antt.BeginUpdate()
oG2antt.Columns.Add("Name")
var_Chart = oG2antt.Chart
	var_Chart.LevelCount = 2
	var_Chart.FirstVisibleDate = "12/28/2000"
	// var_Chart.PaneWidth(false) = 64
	with (oG2antt)
		TemplateDef = [dim var_Chart]
		TemplateDef = var_Chart
		Template = [var_Chart.PaneWidth(False) = 64]
	endwith
var_Items = oG2antt.Items
	h1 = var_Items.AddItem("Item 1")
	var_Items.AddBar(h1,"Task","01/03/2001","01/06/2001")
	h2 = var_Items.AddItem("Item 2")
	var_Items.AddBar(h2,"Task","01/03/2001","01/06/2001")
	// var_Items.ItemBar(h2,"",270) = "1FF"
	with (oG2antt)
		TemplateDef = [dim var_Items,h2]
		TemplateDef = var_Items
		TemplateDef = h2
		Template = [var_Items.ItemBar(h2,"",270) = "1FF"]
	endwith
	var_Items.SchedulePDM(0,"")
oG2antt.EndUpdate()
|