

For example, if PivotRows is empty and PivotColumns is set to "sum(5)/12", the result will display a single row and a column for each unique value in column 12. The row will show the sum of values from column 5, corresponding to each unique value in column 12. The Description(exColumnEmptyPivotRows) and Description(exRowEmptyPivotRows) properties define the column and row captions when no pivot rows have been specified. When no pivot rows are defined, the pivot columns specify the aggregate functions to be applied to the entire data set (without pivot row grouping). By default, Description(exColumnEmptyPivotRows) is an empty string (""), and Description(exRowEmptyPivotRows) is set to "Total".
For instance:
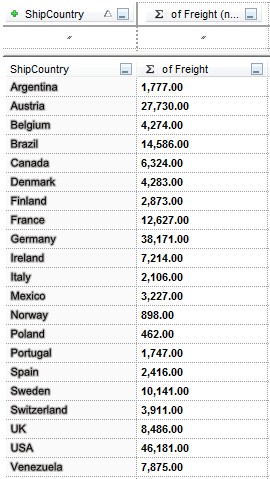
- "sum(5)[bold,content=numeric]", adds a single column that displays the sum of data column with the index 5, and its content will be displayed as numeric and in bold.
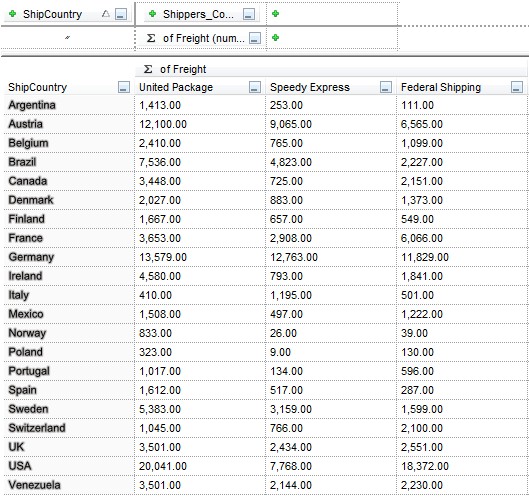
- "sum(5)[content=numeric]/12", adds a column for each unique value found in the data column with the index 12, and each column displays the sum of data column with the index 5 as numeric, associated with the value of the data column.
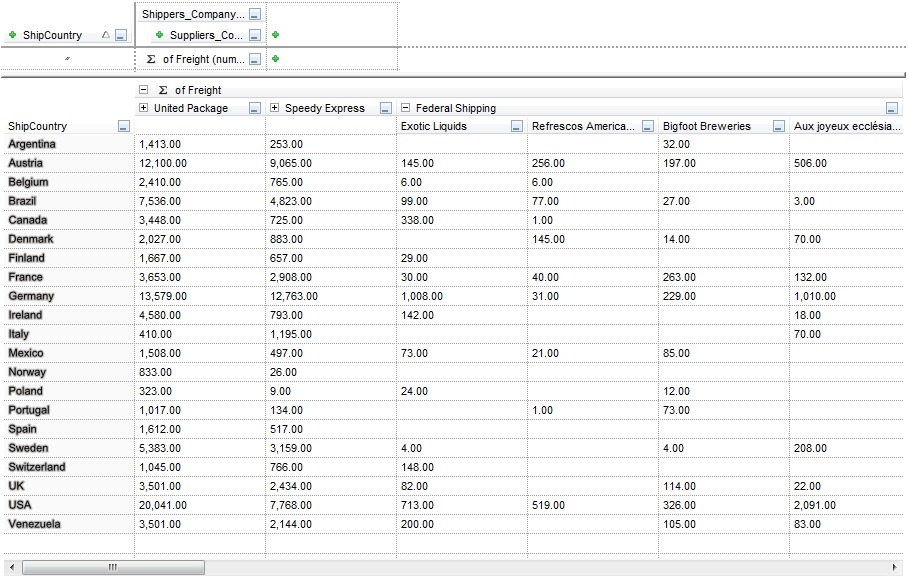
- "sum(5)[content=numeric]/12;6", groups by data columns with the index 12 and 6, and adds a new column for each unique value found, by displaying the sum of data column with the index 5 as numeric, for the associated values in the data columns.
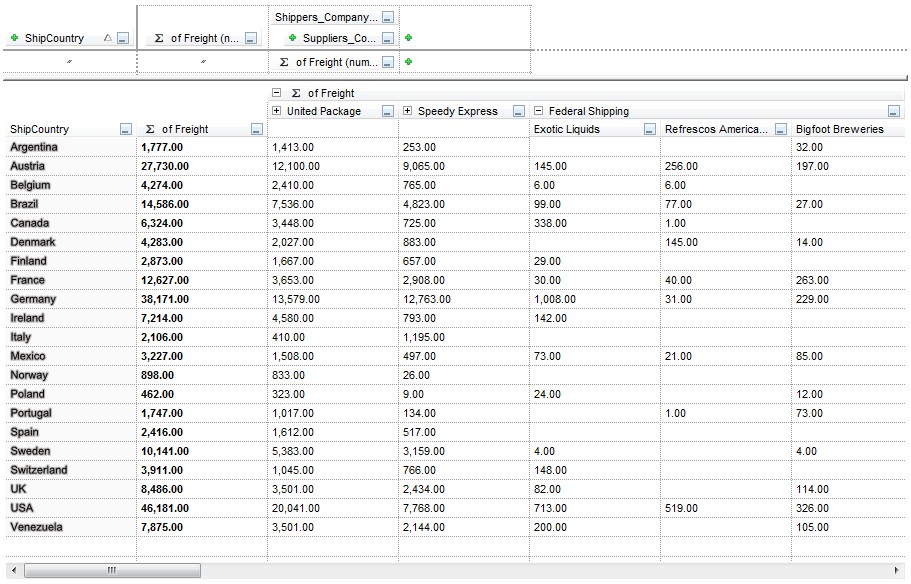
- "sum(5)[bold,content=numeric],sum(5)[content=numeric]/12;6", adds a single column that displays the sum of data column with the index 5 in bold as numeric, and follows the group-by data columns shown earlier.
The PivotColumns in BNF notation is:
PivotColumns ::= "<Aggregate>[,<Aggregate>]"
Aggregate ::= <AggregateKey>(<Index>)[<Options>] | <AggregateKey>(<Index>)[<Options>]/<Index>[:<Order>][<Options>][;<Index>[:<Order>][<Options>]]
Index ::= <Digit>[<Digit>]
Digit ::= 0 | 1 | 2 | 3 | 4 | 5 | 6 | 7 | 8 | 9
Order ::= A | D
Options ::= \[<Option> | ,<Option>\]
Option ::= <CheckOption> | content=<RadioOption>
where
- AggregateKey, is any Key in the Aggregates collection
- Index, is the index of the Column, a value between 0 and DataColumns.Count - 1
- CheckOption is any Key in the FormatAppearances collection
- RadioOption is any Key in the FormatContents collection
The following screen shot shows how the columns in the control's list, may look like if the PivotColumns property is "sum(5)[bold,content=numeric]":
The following screen shot shows how the columns in the control's list, may look like if the PivotColumns property is "sum(5)[content=numeric]/12":
The following screen shot shows how the columns in the control's list, may look like if the PivotColumns property is "sum(5)[content=numeric]/12;6":
The following screen shot shows how the columns in the control's list, may look like if the PivotColumns property is "sum(5)[bold,content=numeric],sum(5)[content=numeric]/12;6":
The control can load data using one of the following methods:
- Import method, loads data from a CSV file or from specified text.
- DataSource property, assigns an ADO/DAO record set to be loaded.
- LoadXML method, loads an XML file previously saved using the SaveXML method
- The user can drag and drop any TXT or XML files to the control.
Once the data is loaded to the control, the user can drag and drop columns to summarize the data or set the following properties in the following order:
- PivotRows property, specifies the list of columns that determines the first column in the control's list
- PivotColumns property, specifies the list of columns that determines the rest of the columns in the control's list
- PivotTotals property, specifies the list of aggregate functions to be displayed in the control's list