The Exontrol's exG2antt component is an editable grid component that includes Gantt chart features. The ex(G)rid-ex(G)antt, shortly exG2antt or ex2Gantt, combines the exGrid and exGantt components in a standalone component. In other words, it combines a multiple columns editable Tree/Grid control with Gantt features, in a single component.
The major difference between eXGantt and eXG2antt is that eXGantt is a read
only control, so actually it is provided for viewing data only, while using the
eXG2antt users can edit/update at runtime the data (cells, bars, links, and so on ). You can find more differences between these controls here.
By default, the exg2antt setup installs the exprint.dll in your system
folder. If you can't locate there, please feel from to download it from
our web site. The Exontrol's ExPrint component ( exprint.dll ) provides
Print and Print Preview capabilities for the exG2antt component, as well
for other components too. Once that you can have the exPrint component
in your Components list, insert a new instance of "ExPrint 1.0
Control Library" to your form and add the following VB code:
The following VB sample opens the Print Preview frame:
With Print1
    Set .PrintExt = G2antt1.Object
    .Preview
End With
The following C++ sample opens the Print Preview frame:
The Exontrol's ExPrint component provides print
and print preview capabilities for the component. The Options
property of the ExPrint object may be used to pass custom options for
the print and print preview of the component.
You can use the StartPrintDate
and EndPrintDate
properties to specify the range to print the chart. If these are not
implemented, you still can print a specified range using the Options
property as follow:
Currently, the component supports the following options:
DateStart, indicates the new starting date for the print
and print preview. If missing, the default starting date is
used.
DateEnd, indicates the new ending date for the print and
print preview. If missing, the default ending date is used.
ColumnsOnEveryPage=#value#, specifies that the control prints the columns section on each page, if the value is not zero. If the ColumnsOnEveryPage option is negative, its absolute value minus one, indicates the index of the column being printed on each page, else if positive, it indicates the maximum ratio of page's width that can be covered by the columns section on every
page as the following samples:
ColumnsOnEveryPage=0.5, specifies whether the control prints
the columns section on each page, and the area being used by the
columns section is not larger than half of the page.
ColumnsOnEveryPage=-1, specifies whether the control prints
the column ( with the index 0 ) section on each page.
FitToPage = On, specifies that the control's content to be
previewed / printed to a single page ( Fit-To-Page option ). The FitToPage option could be one of the following:
On, (Fit-To-Page) the control's content is printed to a single page ( version 6.1 )
p%, (Adjust-To) where p is a positive number that indicates the percent from normal size to adjust to. For instance, the
"FitToPage = 50%" adjusts the control's content to 50% from normal size. ( version
8.0 )
w?x, (Fit-To Wide) where w is a positive number that indicates that the control's content fits w pages wide by how many pages tall are required. For instance,
"FitToPage = 3 x" fits the control's content to 3 pages wide by how many pages tall is are required. ( version
8.0 )
x?t, (Fit-To Tall) where t is a positive number that specifies that the control's content fits t pages tall by how many pages wide are required. For instance,
"FitToPage = x 2" fits the control's content to 2 pages tall by how many pages wide are required. ( version
8.0 )
w?x?t, (Fit-To) where w and t are positive numbers that specifies that the control's content fits w pages wide by t pages tall. For instance,
"FitToPage = 3 x 2" fits the control's content to 3 pages wide by 2 pages tall. ( version
8.0 )
Print = Selection, prints only the selected items (
including the associated bars ). If the option is missing, the
entire chart is printing.
For instance, the following VB sample specifies the new dates for the
chart:
With Print1
        ' Use the DateStart and DateEnd options to specify the new range for printing the chart
        .Options = "DateStart = Oct 17 2005; DateEnd = 12/1/2005"
        Set .PrintExt = G2antt1.Object
        .Preview
End With
The options are separated by ';' character or newline sequence (
"\r\n" or vbCrLf, ... ), and specifies the name of the option,
the '=' character and value of the option, like: "DateStart = Oct 17 2005; DateEnd = 12/1/2005"
Another option to print an user selected area is is to right click
the document in print preview, and define the new selected area by
moving the mouse while the right button is clicked. The user selected
area is painted in blue. This way you can print on the paper only the
blue section in the preview document.
Yes. Please check the BarsAllowSizing
property. The BarResize
event is fired when the user moves or resizes a bar. Use the ItemBar
property to access a property of the bar.
You need to add a handler for DblClick
event. Next, use the BarFromPoint
property to determine the key of the bar from the cursor.
The following VB sample displays a message box when user double clicks a
bar:
Private Sub G2antt1_DblClick(Shift As Integer, X As Single, Y As Single)
    With G2antt1.Chart
        Dim k As Variant
        k = .BarFromPoint(-1, -1)
        MsgBox k
    End With
End Sub
The following VFP sample displays a message box when user double clicks a
bar:
*** ActiveX Control Event ***
LPARAMETERS shift, x, y

with thisform.G2antt1.Chart
local k
k = .BarFromPoint(-1,-1)
MessageBox(k)
endwith
You can use the Zoom method.
Use the Level
property to access any level in the control's header. Each level has a Level object, where you can change the following properties:
Label,
Unit and
Count.
Please check also the UnitWidth property, that indicates the width
in pixels of the minimal level.
The RemoveAllItems
method removes all items. The bars and links related to an item, are
removed when an item is removed. Use the Clear
method to clear the columns collection. The RemoveAllItems method is
called automatically when the Clear method is called.
The ItemBar
property accesses properties for a specified bar. The ItemBar(exBarStart)
property indicates the time where the bar begins. The ItemBar(exBarEnd)
property indicates the time where the bar ends.
Open the control's help file ( click the Start button, click the Run
item, and type exg2antt.chm, and press enter ), and locate the ItemBar
property in the Items collection. Click the ItemBarPropertyEnum
type of the Property parameter. There you will find a table with all
supported properties. The first column indicates the name of the
constant, the second column indicates the value of the constant, and the
last column describes what the property does.
Please check the Items.ItemBar(,,
exBarHAlignCaption ) property. The exBarHAlignCaption option aligns the
caption in the bar. Use the AddBar
property to assigns a caption to a bar.
Please check the Chart.DateFromPoint
and Chart.BarFromPoint
property. The DateFromPoint property determines the date from point. The
BarFromPoint property determines the key of the bar from the point. Use
the Items.ItemBar
property to access the bar inside the item. The ItemFromPoint
property retrieves the handle of the item from the point.
The Bars.AddShapeCorner
property defines a new bar based on an icon. Use the Images
method or ReplaceIcon
property to add new icons to the control's images collection.
Use the Items.ExpandItem
property to expand an item.
The following VB sample expands all items:
With G2antt1
    .BeginUpdate
    With .Items
        For Each h In G2antt1.Items
            .ExpandItem(h) = True
        Next
    End With
    .EndUpdate
End With
The following VFP sample expands all items:
with thisform.G2antt1
	.BeginUpdate
	with .Items
	for each h in thisform.G2antt1.Items
		.DefaultItem = h
		.ExpandItem(0) = .t.
	next
	endwith
	.EndUpdate
endwith
The AllowCreateBar
property specifies whether the user can create new bars using the mouse.
If the AllowCreateBar property is True, the CreateBar
event is fired when the user releases the mouse in the chart area. Just
call the AddBar
method during the CreateBar event, in order to add new bars to the item.
The CellFont
property specifies the font being used in the cell. The ItemFont
property specifies the item's font. If any of this properties are not
set, the control's Font
specifies the cell's font. Use the ItemHeight
property to change the item's height.
The control supports filtering items using AND, OR, NOT
operators between columns. The FilterCriteria
property specifies the filter criteria. In your case, if you
have three columns, the control's FilterCriteria property
should be "%0 or %1 or %2". The "not
%1" specifies that the second column ( column's index
is 1 ) excludes the values selected in the drop down filter
window.
The Chart.BarFromPoint
property determine the key of the bar from point. The ItemFromPoint
property determines the item from point.
The following VB sample displays the start data of the
bar from the point:
Private Sub G2antt1_MouseDown(Button As Integer, Shift As Integer, X As Single, Y As Single)
    With G2antt1
        Dim h As HITEM, c As Long, hit As HitTestInfoEnum
        h = .ItemFromPoint(-1, -1, c, hit)
        If Not (h = 0) Then
            Dim k As Variant
            k = .Chart.BarFromPoint(-1, -1)
            If Not IsEmpty(k) Then
                Debug.Print .Items.ItemBar(h, k, exBarStart)
            End If
        End If
    End With
End Sub
The following C++ sample displays the start data of the
bar from the point:
#include "Items.h"
#include "Chart.h"

CString V2Date( VARIANT* pvtValue )
{
	COleVariant vtDate;
	vtDate.ChangeType( VT_BSTR, pvtValue );
	return V_BSTR( &vtDate );
}

void OnMouseDownG2antt1(short Button, short Shift, long X, long Y)
{
	long c = 0, hit = 0, h = m_g2antt.GetItemFromPoint( -1, -1, &c, &hit );
	if ( h != 0 )
	{
		COleVariant vtKey = m_g2antt.GetChart().GetBarFromPoint( -1, -1 );
		if ( V_VT( &vtKey ) != VT_EMPTY )
		{
			COleVariant vtStart = m_g2antt.GetItems().GetItemBar( h, vtKey, 1 /*exBarStart*/ );
			OutputDebugString( V2Date( &vtStart ) );
		}
	}
}
The following VB.NET sample displays the start data of
the bar from the point:
Private Sub AxG2antt1_MouseDownEvent(ByVal sender As Object, ByVal e As AxEXG2ANTTLib._IG2anttEvents_MouseDownEvent) Handles AxG2antt1.MouseDownEvent
    With AxG2antt1
        Dim c As Long, hit As EXG2ANTTLib.HitTestInfoEnum, h As Integer = .get_ItemFromPoint(-1, -1, c, hit)
        If Not (h = 0) Then
            Dim k As Object
            k = .Chart.BarFromPoint(-1, -1)
            If Not k Is Nothing Then
                System.Diagnostics.Debug.WriteLine(.Items.ItemBar(h, k, EXG2ANTTLib.ItemBarPropertyEnum.exBarStart))
            End If
        End If
    End With
End Sub
The following C# sample displays the start data of the
bar from the point:
private void axG2antt1_MouseDownEvent(object sender, AxEXG2ANTTLib._IG2anttEvents_MouseDownEvent e)
{
	int c = 0;
	EXG2ANTTLib.HitTestInfoEnum hit = EXG2ANTTLib.HitTestInfoEnum.exHTCell;
	int h = axG2antt1.get_ItemFromPoint(-1, -1, out c, out hit);
	if (h != 0)
	{
		object k = axG2antt1.Chart.get_BarFromPoint(-1, -1);
		if (k != null)
			System.Diagnostics.Debug.WriteLine( axG2antt1.Items.get_ItemBar( h, k, EXG2ANTTLib.ItemBarPropertyEnum.exBarStart ) );
	}
}
The following VFP sample displays the start data of the
bar from the point:
*** ActiveX Control Event ***
LPARAMETERS button, shift, x, y

With thisform.G2antt1
	local h, c, hit
    h = .ItemFromPoint(-1, -1, c, hit)
    If (h # 0) Then
        local k
        k = .Chart.BarFromPoint(-1, -1)
        If !Empty(k) Then
            ? .Items.ItemBar(h, k, 1)
        EndIf
    EndIf
EndWith
Please set the Chart.DrawDateTicker
property on False. The DrawDateTicker property retrieves or sets a value
that indicates whether the control draws a ticker around the current
date while cursor hovers the chart's client area.
LOCAL h
SCAN
	_key="K_"+ALLTRIM(STR(projekte.ID))
	WITH THISFORM.myplan.Items
		h = .AddItem(ALLTRIM(projekte.project_name))
		.AddBar( h,"Project Summary" , DTOT(projekte.sdate),DTOT(projekte.edate), _key, "" )
		.ItemBar( h ,_key,3 ) = "my text"
	ENDWITH
ENDSCAN
The h variable indicates the handle of the newly created item. This
value is always greater than 65000, so the VFP environment always fires
an error when compiling the AddBar and ItemBar properties because it
considers accessing an array, and its limit is 65000. Of course this
problem is related to VFP ignoring the fact that it is calling a
property! not an array, so our products provide a DefaultItem property
that help VFP users to pass this error. So, in VFP the above code should
look like follows:
The difference ( marked in red ) is that the first parameter for
properties like AddBar and ItemBar is 0, and before calling them the
Items.DefaultItem property indicates the handle of the item being
accessed. How it works? The control uses the value of the
Items.DefaultItem property, when the first parameter of the ItemBar,
AddBar and so on is 0. The AddItem property saves before the handle of
the newly created item to the DefaultItem property, and so the VFP error
is gone, and the code works like you expect.
For example, I only want to scroll the date between Jan 1, 2005 up to
Dec 31, 2006. It seems that the chart can scroll an endless date and I
only want to limit to scroll the chart date from Jan 1, 2005 to Dec 31,
2006. The control fires the DateChange
event when the user scrolls the chart's area, or if the FirstVisibleDate
property is changed.
The following VB sample limits the scrolling area to Dec 31, 2006,
from Jan 1, 2005.
Private Function LastVisibleDate(ByVal g As EXG2ANTTLibCtl.G2antt) As Date
    With G2antt1
        With .Chart
            Dim d As Date
            d = .FirstVisibleDate
            Do While .IsDateVisible(d)
                d = .NextDate(d, exDay, 1)
            Loop
        End With
    End With
    LastVisibleDate = d - 1
End Function

Private Sub G2antt1_DateChange()
    Dim dMin As Date, dMax As Date
    dMin = "1/1/2005"
    dMax = "31/12/2006"
    With G2antt1.Chart
        If .FirstVisibleDate < dMin Then
            .FirstVisibleDate = dMin
        End If
        If LastVisibleDate(G2antt1) > dMax Then
            .FirstVisibleDate = dMax - (LastVisibleDate(G2antt1) - .FirstVisibleDate) + 1
        End If
    End With
End Sub
The ItemBar(exBarStart)
and ItemBar(exBarEnd) properties specify the starting and ending
date of the bar. A bar is determined by the starting and ending date.
The following C++ function determines whether two bars are
intersected:
BOOL Intersection( DATE aStart, DATE aEnd, DATE bStart, DATE bEnd )
{
	DATE am = MIN( aStart, aEnd ), aM = MAX( aStart, aEnd );
	DATE bm = MIN( bStart, bEnd ), bM = MAX( bStart, bEnd );
	if ( bM < am )
		return FALSE;
	if ( bm > aM )
		return FALSE;
	return TRUE;
}
where the MIN and MAX functions determines the minimum and maximum
values like follows:
DATE MIN( DATE a, DATE b )
{
	if ( a < b )
		return a;
	return b;
}
DATE MAX( DATE a, DATE b )
{
	if ( a > b )
		return a;
	return b;
}
In VB the functions looks like follows:
Private Function Intersect(ByVal aStart As Date, ByVal aEnd As Date, ByVal bStart As Date, ByVal bEnd As Date) As Boolean
    Dim aMin As Date, aMax As Date
    aMin = MIN(aStart, aEnd)
    aMax = MAX(aStart, aEnd)
    Dim bMin As Date, bMax As Date
    bMin = MIN(bStart, bEnd)
    bMax = MAX(bStart, bEnd)
    If (bMax < aMin) Then
        Intersect = False
        Exit Function
    End If
    If (bMin > aMax) Then
        Intersect = False
        Exit Function
    End If
    Intersect = True
End Function
where the MIN and MAX functions looks like:
Private Function MIN(ByVal a As Date, ByVal b As Date) As Date
    If (a < b) Then
        MIN = a
        Exit Function
    End If
    MIN = b
End Function

Private Function MAX(ByVal a As Date, ByVal b As Date) As Date
    If (a > b) Then
        MAX = a
        Exit Function
    End If
    MAX = b
End Function
By default, the control doesn't select the item being expanded or
collapsed, when the user clicks the +/- buttons. Thought you can have
the item selected, by handling the AfterExpandItem
event like in the following sample:
Private Sub G2antt1_AfterExpandItem(ByVal Item As EXG2ANTTLibCtl.HITEM)
    G2antt1.Items.SelectItem(Item) = True
End Sub
Use the SelectItem
property to select or unselect a specified item.
The control provides the Copy
method that saves the control's content to clipboard, in Enhanced Metafile
(EMF) format. The Enhanced Metafile format is a 32-bit format that can contain both vector information and bitmap information. This format is an improvement over the Windows Metafile Format and contains extended features, such as the following:
Built-in scaling information
Built-in descriptions that are saved with the file
Improvements in color palettes and device independence
The EMF format is an extensible format, which means that a programmer can modify the original specification to add functionality or to meet specific needs. You can paste this
format to Microsoft
Word, Excel, Front Page, Microsoft Image Composer and any application that know to handle
EMF formats.
The LevelCount
property specifies the number of levels being displayed.
The Level
property retrieves the level object to access the Label
the and Unit
properties that specifies the label being displayed in the level, and
the unit being displayed. The Count
property specifies the number of units displays at once. The FirstVisibleDate
property specifies the first date/time being visible in the chart's
area.
1
The first level displays each month in the year, the
next level displays the week numbers.
The first level displays the month, the year and the number of the
week in the year , the second level displays the name of the week day,
and the third level displays the day of the month. Here's the template:
The following VB sample displays your header using 3 levels as shown
above:
With G2antt1
    .BeginUpdate
    With .Chart
        .LevelCount = 3
        With .Level(0)
            .Label = "<b><%mmm%>, <%yyyy%></b> <r>Week: <%ww%>"
            .Unit = EXG2ANTTLibCtl.UnitEnum.exWeek
        End With
        .Level(1).Label = "<%d1%>"
        .Level(2).Label = "<%d%>"
    End With
    .EndUpdate
End With
The following VFP sample displays your header using 3 levels:
with thisform.g2antt1
.BeginUpdate()
with .Chart
	.LevelCount = 3
	with .Level(0)
		.Label = "<b><%mmm%>, <%yyyy%></b> <r>Week: <%ww%>"
		.Unit = 256
	endwith
	.Level(1).Label = "<%d1%>"
	.Level(2).Label = "<%d%>"
endwith
.EndUpdate()
endwith
The following VB.NET sample displays your header using 3
levels:
With AxG2antt1
    .BeginUpdate()
    With .Chart
        .LevelCount = 3
        With .Level(0)
            .Label = "<b><%mmm%>, <%yyyy%></b> <r>Week: <%ww%>"
            .Unit = EXG2ANTTLib.UnitEnum.exWeek
        End With
        .Level(1).Label = "<%d1%>"
        .Level(2).Label = "<%d%>"
    End With
    .EndUpdate()
End With
The following C# sample displays your header using 3 levels:
The control provides the SaveXML
method that saves the control's data to XML document. Use the LoadXML
method to load XML documents saved using the SaveXML method. The SaveXML
method may save data to a file , an XML document object, or a custom
object that supports persistence like described here:
String - Specifies the file name. Note that this must be a file
name, rather than a URL. The file is created if necessary and the
contents are entirely replaced with the contents of the saved
document. For example:
G2antt1.SaveXML("sample.xml")
or
SaveXML(CType("sample.xml", Object)
Reference to a String member - Saves the control's content to the string member. Note that the string member must be empty, before calling the SaveXML method. For example:
Dim s As String
G2antt1.SaveXML s
In VB.NET for /NET assembly, you should call such as :
Dim s As String = String.Empty
G2antt1.SaveXML(s)
In C# for /NET assembly, you should call such as :
string s = string.Empty;
G2antt1.SaveXML(ref s);
XML Document Object. For example:
Dim xmldoc as Object
Set xmldoc = CreateObject("MSXML.DOMDocument")
G2antt1.SaveXML(xmldoc)
Custom object supporting persistence - Any other
custom COM object that supports QueryInterface for IStream,
IPersistStream, or IPersistStreamInit can also be
provided here and the document will be saved accordingly. In the IStream
case, the IStream::Write method will be called as it saves
the document; in the IPersistStream case, IPersistStream::Load
will be called with an IStream that supports the Read,
Seek, and Stat methods.
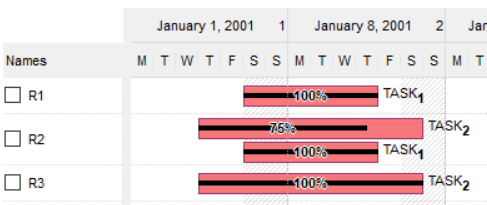
The Color
property of the Bar object specifies the color being used to paint the
bar. This property changes the colors for all bars with the same name.
For instance, if you have 3 "Task" bars, and you are changing
the color for the "Task" bar, the color is applied to all
"Task" bars in the chart. For instance, in order to provide
"Task" bars with different colors, you can use the Copy
method to copy the Task bar to a new bar, and use the Color to change
the color of the bar. The following function generates a Task bar with
specified color:
Private Function AddTask(ByVal gantt As EXG2ANTTLibCtl.G2antt, ByVal clr As Long) As String
    Dim sT As String
    sT = "Task:" & clr
    With gantt.Chart.Bars.Copy("Task", sT)
        .color = clr
    End With
    AddTask = sT
End Function
The function generates a new bar with the name "Task:color",
where the color is the color being used, and retrieves the name of the
new bar being added. The Copy method retrieves the bar being found with
specified name, or creates a new bar if the name is not found in the
Bars collection, so AddTask function gets you the name of the bar you
should use to specify the color for the bar being added as in the
following sample:
With G2antt1.Items
	Dim d As Date
	d = G2antt1.Chart.FirstVisibleDate
	.AddBar .FirstVisibleItem, AddTask(G2antt1, vbRed), d, d + 4, "Red"
End With
The MarkSelectDateColor
property specifies the color being used to mark the selected dates. If
the MarkSelectDateColor property is the same as the BackColor
property of the Chart
object, the selected dates are not shown.
The NonworkingHours
property specifies the non-working hours in a day. The non-working hours
are shown, if your chart displays hours or groups of hours in a day. The
NonworkingDays
property specifies the non-working days in a week. The non-working days
are shown if the chart displays days or group of days.
The ScrollOrderParts
does the trick. The left and right buttons are displayed together if you
call ScrollOrderParts = "l,r". Using the ScrollOrderParts
property you can customize the position of the buttons in the control's
scroll bars.
The CustomFilter
property of the Column object. specifies the list of custom filters that
appear in the drop down filter window. For instance, if the CustomFilter
= "Excel Spreadsheets (*.xls )||*.xls|||Word Documents||*.doc|||Powerpoint
Presentations||*.pps|||Text Documents (*.log,*.txt)||*.txt|*.log"
the drop down filter window shows the following pre-defined
filters:
Excel Spreadsheets (*.xls )
Word Documents
Powerpoint Presentations
Text Documents (*.log,*.txt)
So, if the user selects the Word Documents, the control filters the
column for cells that matches the "*.doc" pattern.
The Link(exLinkText)
property specifies the HTML text being displayed on the link. The AddLink
method adds a link between two bars. The HTMLPicture
property adds a picture that can be used in HTML strings, using the <img>
tag. For instance the following code G2antt1.Items.Link("Link",
exLinkText) = " <img>excel</img><br><br><b>doc.xls"
assigns a text to the link, and it shows like follows:
If the HTMLPicture property doesn't include any excel
identifier, the image on the link is not displayed, so the <img>
tag is ignored.
Use the Add("Task%Progress") method to add a Task bar that displays a Progress bar over.
Use the ItemBar(,,exBarPercent) property to specify the percent from the full bar to display the Progress shape.
You can combine any bars. For example, you can merge "Summary" with "Progress" to create "Summary%Progress," or combine "Summary" with "Task" to form "Summary%Task," which will display a Task shape layered over a Summary shape. The appearance of the new bar is influenced by the appearance of the bars it combines. You can customize the appearance of any combined bar using its Color property, applying either a solid color or an EBN color (skin).
The following Template adds a column, an item and a percent-bar:
In this example, we create a percent bar with the shortcut "TP," which is used in the AddBar method to assign the percent bar to an item. The ItemBar(,12) property sets the percent value to 0.3 (representing 30%), and the second ItemBar(,14) property ensures that the percent text is displayed.
The HitTestInfoEnum.exHTBetween
value indicates whether the cursor is between two items. For instance, you can
provide a visual effect for the item while performing OLE drag and drop
operations, when the cursor is in the top half of the item, using the exDragDropListTop,
or in the second half using the exDragDropListBottom value. In the same way you
can provide a visual effect when the cursor is over or between two items, using
the exDragDropListOver and exDragDropListBetween values. The ItemFromPoint
property retrieves the handle of the item from the cursor, and retrieves also a
code (HitTestInfo parameter), to indicate the part in the item where the cursor
is. So, the exHTBetween value indicates whether the cursor is between items. The
exHTBetween is an OR combination with other predefined values, so you must call HitTestInfo
AND 0x1000 to check if the cursor is between rows/items as in the following
samples:
The following VB sample displays a message when the cursor is between two
items:
Private Sub G2antt1_MouseMove(Button As Integer, Shift As Integer, X As Single, Y As Single)
    Dim i As HITEM, c As Long, h As HitTestInfoEnum
    i = G2antt1.ItemFromPoint(-1, -1, c, h)
    If Not (i = 0) Then
        If (h And exHTBetween) Then
            Debug.Print "The cursor is between two items."
        Else
            Debug.Print "The cursor is over the item."
        End If
    End If
End Sub
The following VB.NET sample displays a message when the cursor is between two
items:
Private Sub AxG2antt1_MouseMoveEvent(ByVal sender As System.Object, ByVal e As AxEXG2ANTTLib._IG2anttEvents_MouseMoveEvent) Handles AxG2antt1.MouseMoveEvent
    With AxG2antt1
        Dim c As Integer, h As EXG2ANTTLib.HitTestInfoEnum
        Dim i As Integer = .get_ItemFromPoint(-1, -1, c, h)
        If Not i = 0 Then
            If (h And EXG2ANTTLib.HitTestInfoEnum.exHTBetween) Then
                Debug.Print("The cursor is between items.")
            Else
                Debug.Print("The cursor is over the item.")
            End If
        End If
    End With
End Sub
The following C# sample displays a message when the cursor is between two
items:
private void axG2antt1_MouseMoveEvent(object sender, AxEXG2ANTTLib._IG2anttEvents_MouseMoveEvent e)
{
    int c = 0;
    EXG2ANTTLib.HitTestInfoEnum h;
    int i = axG2antt1.get_ItemFromPoint(-1, -1, out c, out h);
    if (i != 0)
        if ( (h & EXG2ANTTLib.HitTestInfoEnum.exHTBetween) == EXG2ANTTLib.HitTestInfoEnum.exHTBetween )
            System.Diagnostics.Debug.Print("The cursor is between items.");
        else
            System.Diagnostics.Debug.Print("The cursor is over the item.");
}
The following C++ sample displays a message when the cursor is between two
items:
void OnMouseMoveG2antt1(short Button, short Shift, long X, long Y)
{
	long c = 0, h = 0;
	long i = m_G2antt.GetItemFromPoint( -1, -1, &c, &h );
	if ( i != 0 )
		if ( h & 0x1000 /*exHTBetween*/ )
			OutputDebugString( "The cursor is between items.\n" );
		else
			OutputDebugString( "The cursor is over the item.\n" );
}
The following VFP sample displays a message when the cursor is between two
items:
*** ActiveX Control Event ***
LPARAMETERS button, shift, x, y

local c, hit
c = 0
hit = 0
with thisform.G2antt1
	.Items.DefaultItem = .ItemFromPoint( x, y, @c, @hit )
	if ( .Items.DefaultItem <> 0 )
		if bitand(hit,0x1000) = 0x1000
			wait window nowait "The cursor is between items."
		else
			wait window nowait "The cursor is over the item."
		endif
	endif
endwith
Use the PaneWidth
property to change the width of the left or right panel in the Gantt control.
The following VB sample resizes the chart area as soon as the Gantt control
is resized:
Private Sub Form_Resize()
On Error Resume Next
    With G2antt1
        .BeginUpdate
        .Width = ScaleWidth - 2 * .Left
        .Height = ScaleHeight - 2 * .Top
        .Chart.PaneWidth(True) = .Width / Screen.TwipsPerPixelX / 2
        .EndUpdate
    End With
End Sub
The following VFP sample resizes the chart area as soon as the Gantt control
is resized:
The following VB.NET sample resizes the chart area as soon as the Gantt
control is resized:
Private Sub AxG2antt1_Resize(ByVal sender As Object, ByVal e As System.EventArgs) Handles AxG2antt1.Resize
    With AxG2antt1
        If (.IsHandleCreated) Then
            .Chart.PaneWidth(True) = .Width / 2
        End If
    End With
End Sub
The following C# sample resizes the chart area as soon as the Gantt control
is resized:
Yes. The BarFromPoint
property to determine the key of the bar from the cursor. The ItemBar(exBarSelectable)
property specifies whether a bar is selectable or not. The BarFromPoint
property can return only selectable bars. By default, all bars are
selectable. So, once the BarFromPoint property returns a bar turn it's
exBarSelectable option on False, so the next calling of the BarFromPoint
property will get the next bar from point if any. At the end restore back the
bar's exbarSelectable option on True.
If you do not require all bars from the cursor, just the bar from the
cursos, the
BarFromPoint property always returns the first found bar at
the specified position, if any, so no need for the following
sample.
The following VB sample displays the keys of the bars
from the cursor ( in case several bars covers each other,
in other words get all bars from the cursor ):
Private Sub G2antt1_MouseMove(Button As Integer, Shift As Integer, X As Single, Y As Single)
    Dim h As HITEM, c As Long, hit As HitTestInfoEnum
    With G2antt1
        h = .ItemFromPoint(-1, -1, c, hit)

        If (h <> 0) Then
            Dim vKey As Variant, vKeys As New Collection

            vKey = .Chart.BarFromPoint(-1, -1)
            While (Not VarType(vKey) = vbEmpty)
                vKeys.Add vKey
                .Items.ItemBar(h, vKey, exBarSelectable) = False
                vKey = .Chart.BarFromPoint(-1, -1)
            Wend

            If (vKeys.Count > 0) Then
                Debug.Print "Bar(s) from the cursor: "
                Dim v As Variant
                For Each v In vKeys
                    .Items.ItemBar(h, v, exBarSelectable) = True
                    Debug.Print v
                Next
                Else
                Debug.Print "No bar at the cursor."
            End If

            Set vKeys = Nothing
        End If
    End With
End Sub
If you do not require all bars from the cursor, the
BarFromPoint property always returns the first found bar at
the specified position, if any.
There are several options in order to display a different content for the
column. By default, the Items.CellValue property indicates the value being shown
in the cell.
Column.FormatColumn property specifies a formula to display the column's
new content, using predefined functions for numbers, strings, dates and so
on.
Change the Value parameter of the FormatColumn event which is fired if the
Column.FireFormatColumn property is True. For instance the following sample
displays the second column using current currency format with 2
decimals. The Item parameter of the FormatColumn event indicates the item
where the cell is hosted, the ColIndex indicates the column where the cell
belongs, while the Value parameter indicates the cell's value before
formatting and after. In case you need formatting multiple columns, you
can distingue them using the ColIndex parameter.
Private Sub Form_Load()
    With G2antt1
        .BeginUpdate
        .Columns.Add "A"
        .Columns.Add("B").FireFormatColumn = True ' Index of it is 1
        With .Items
            .AddItem Array("One", 1)
            .AddItem Array("Two", 2)
        End With
        .EndUpdate
    End With
End Sub

Private Sub G2antt1_FormatColumn(ByVal Item As EXG2ANTTLibCtl.HITEM, ByVal ColIndex As Long, Value As Variant)
    Value = FormatCurrency(Value, 2, vbUseDefault)
End Sub
Assigns an editor to a cell or column using the Items.CellEditor or
Column.Editor. For instance, you have a drop down list editor (
DropDownListType(3) ), which lists predefined values including HTML format,
and so, the cell/column will display the associated string to the cell's
value.
Use the Items.RemoveBar, Items.RemoveLink or Chart.RemoveSelection method to remove a bar/link
or
selected bars/links from the chart. The SelectedObjects property gets the
list of selected bars/links within the chart. The Items.ItemBar(exBarSelected)
property specifies whether the bar is selected or unselected. The
Items.Link(exLinkSelected) property specifies whether the link is selected or
unselected.
The following VB sample removes the selected links only:
With G2antt1
    .BeginUpdate
    With .Items
        For Each l In .SelectedObjects(exSelectLinksOnly)
            G2antt1.Template = "Items.RemoveLink(" & l & ")"
        Next
    End With
    .EndUpdate
End With
The following VB sample removes the selected bars only:
With G2antt1
    .BeginUpdate
    With .Items
        For Each b In .SelectedObjects(exSelectBarsOnly)
            G2antt1.Template = "Items.RemoveBar(" & b & ")"
        Next
    End With
    .EndUpdate
End With
When a bar is removed, any link related to it will be removed.
Each bar is movable inside the item, or it can be moved to another item, using
the ItemBar(exBarCanMoveToAnother[28]) property which specifies whether the bar
can be moved from an item to another. By code, you can use the
Items.ItemBar(exBarParent[512]) property to change the bar's parent from one
item to another. A bar can be moved from an item to another, only if in the
target item there are no other bars with the same key. The control fires the
BarParentChange event just before moving the bar to another item. Use this event
to control the items where your bar can be moved.
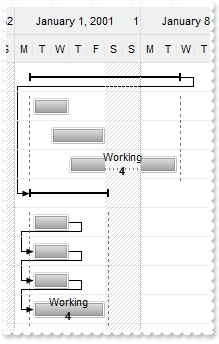
The following VB sample moves the bar "B" from the second item to
the first item:
With G2antt1
	.Chart.FirstVisibleDate = #1/1/2001#
	.Columns.Add "Column"
	With .Items
		.AddBar .AddItem("Item 1"),"Task",#1/2/2001#,#1/4/2001#,"A"
		h = .AddItem("Item 2")
		.AddBar h,"Task",#1/6/2001#,#1/14/2001#,"B"
		.ItemBar(h,"B",exBarParent) = .FirstVisibleItem
	End With
End With
Yes. The ColumnAutoResize property specifies whether the left part of the
control displays a horizontal scroll bar if required, or resizes the visible
columns so all of them are displayed on the left part of the control. So, the
horizontal scroll bar in the left part of the control is not shown while
the ColumnAutoResize property is True. So, in order to display a scrollbar
in the left side of the control, you need to set the ColumnAutoResize property
on False. If the scroll bar is not shown, you can use the ScrollBars property on
exDisableBoth and so the scroll bar is always visible. In conclusion, the
horizontal scroll bar in the left part of the control is shown only if:
ColumnAutoResize property is False
ScrollBars property contains exDisableBoth or exDisableNoHorizontal, or if
not, the scroll bar is shown only if requires. For instance if the width of
the visible columns is less than the control's client area the scroll bar is
not shown, else it is shown.
Yes. The OnResizeControl property specifies the actions the control should do
when the user resizes the control, moves the vertical or the horizontal splitter.
For instance, if the OnResizeControl property is (exResizeChart Or
exDisableSplitter)
the vertical splitter is disabled, so the user can not resize it at runtime, and
if the control get resized, the chart area is being resized.
The OnResizeControl property specifies the actions the control should do when
the user resizes the control, moves the vertical or the horizontal splitter. For
instance, if the OnResizeControl property is (exResizeChart Or exDisableSplitter Or
exDisableHistogram)
the vertical splitter is disabled, so the user can not resize it at runtime, and
if the control get resized, the chart area is being resized. The exDisableHistogram
option specifies that resizing the chart's histogram is disabled at runtime, so
the user will not be able to use the horizontal splitter to resize the
histogram.
The OnResizeControl property specifies the actions the control should do when
the user resizes the control, moves the vertical or the horizontal splitter. For
instance, if the OnResizeControl property is (exResizeChart Or
exSplitterShowButtons)
the vertical splitter is disabled, so the user can not resize it at runtime, and
if the control get resized, the chart area is being resized. The exSplitterShowButtons
option specifies that the vertical splitter shows two buttons, left and right.
Clicking the left button, makes the chart larger, and if the right button is
clicked, the chart area is being hidden, so the items part is larger.
Yes. It is possible. The labels in the levels area in the chart part can be
changed using the Level.Label, ReplaceLabel or FormatLabel property. For
instance, if you need to display numbers just change the levels' Label property
to "<%i%>" which will determine the chart to display
numbers. If you need to go to the 0 just call Chart.FirstVisibleDate property on
0, and so on. In conclusion check the following properties of the Level object:
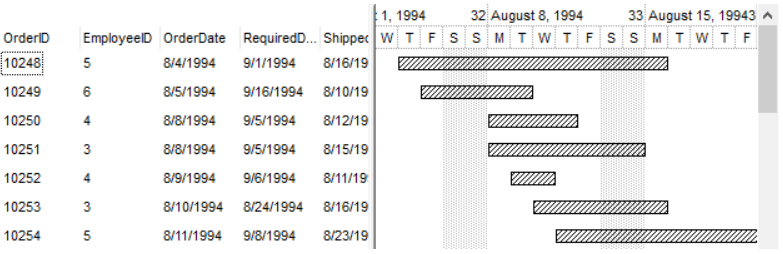
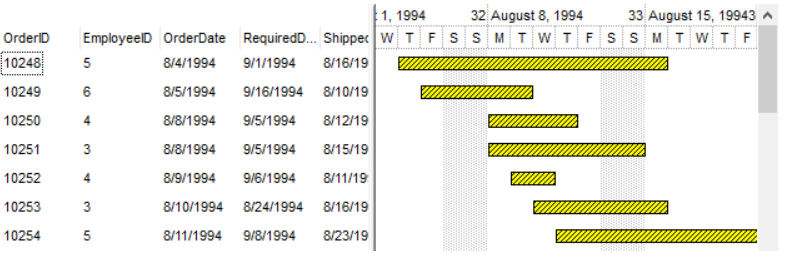
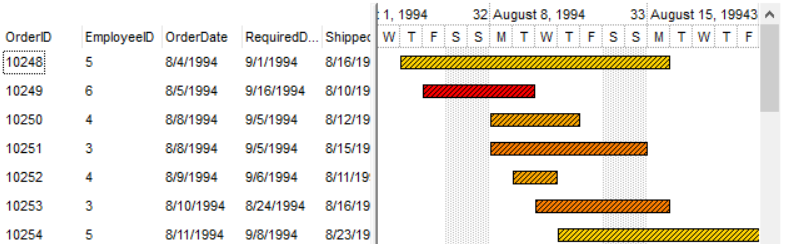
Indeed the recordset being passed to the DataSource property fills the items
area only, letting the chart area empty. This is not a limitation and lets you
several ways to fill the chart area by code using the AddItem event . The AddItem
event notifies your application once a new item has been added to the Items
collection. When calling the DataSource property the recordset is being parsed,
and once a new record is found in the table a new item is added to the Items
collection, so the AddItem event is fired. More than that during the AddItem
event the current record in the recordset indicates the item being filled. For
instance, the following VB sample fills and adds data from DataSource, and in
the same time, the values are being updated automatically, including cells and
bars:
Private Sub G2antt1_AddItem(ByVal Item As EXG2ANTTLibCtl.HITEM)
With G2antt1.Items
.AddBar Item, "Task", .CellValue(Item, "OrderDate"), .CellValue(Item, "ShippedDate")
End With
End Sub
Private Sub Form_Load()
With G2antt1
.BeginUpdate
.ContinueColumnScroll = False
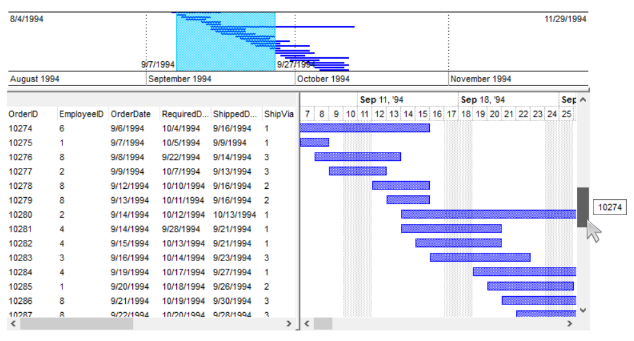
.ColumnAutoResize = False
.Chart.OverviewVisible = True
Set rs = CreateObject("ADOR.Recordset")
With rs
.Open "Orders", "Provider=Microsoft.Jet.OLEDB.4.0;Data Source=C:\Program Files\Exontrol\ExTree\Sample\VB\SAMPLE.MDB", 3, 3
End With
.DataSource = rs
.Columns("OrderDate").Def(exCellValueToItemBarProperty) = ItemBarPropertyEnum.exBarStart
.Columns("ShippedDate").Def(exCellValueToItemBarProperty) = ItemBarPropertyEnum.exBarEnd
.Items.AllowCellValueToItemBar = True
.EndUpdate
End With
End Sub
The sample call first the DataSource property with the SQL recordset we have.
We presume, that the loaded table has at least 2 DATE fields that we can use in
order to specify the start and end points for each bar. Next we specify the
starting and ending points for all bars in the chart being represented by the OrderDate
and ShippedDate columns. The
AddItem event just adds a new bar for each item using the starting and ending
points. If you would run the sample, the table is being updated as soon as a
cell's value is changed, or a bar is moved or resized.
By default, when user links two bars, the link's ID starts with
"Link". The AllowLink
event notifies your application just before adding a new link at runtime. The
LinkKey parameter is passed by reference, so you can change it during the
AllowLink event. Currently, if the link is already added you can change it's key
only if you remove and add a new link.
You can use the bar's transparency using the Items.ItemBar(exBarTransparent), or
you can change the color for the EBN file being displayed by the bar using the
Items.ItemBar(exBarColor). For instance, if the bar has assigned an EBN to be
shown, you can control the color that EBN shows using the
Items.ItemBar(exBarColor) property. The following link
shows how to apply a different color for a specified EBN object.
The identifiers of the EBN objects are arbitrary, you can specify from 1 to
127, and has nothing associated with any part of the control. You simple design
the values you need in your application. Imagine that each EBN file has an unique
identifier , 1, 2, .... and so on.
When referring in the color properties just use the identifier of the ebn, and
so it will be used. In other words, the identifier is being used to specify the
EBN being used by the color property to apply on the control's part.
It means you have added the identifiers 12, 22, and 8 absolutely random. When
you need to display in some part of the control some ebn, let's say ebn2, you
need its identifier, so the back color property will be 0x22000000, It always
need 6 zeros after the identifier.
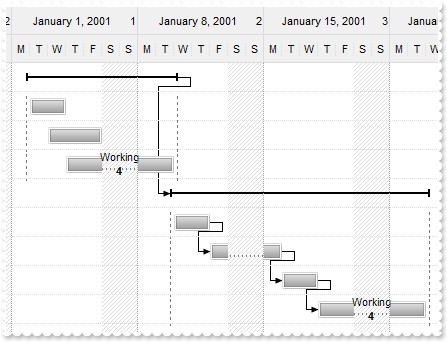
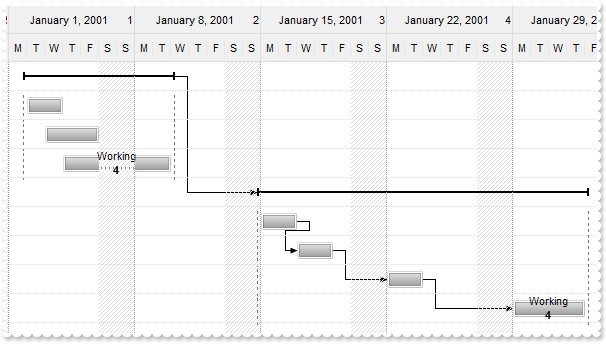
Yes. The Chart.ScrollRange
property specifies the range of the chart to be scrollable.
With G2antt1
	.Columns.Add "Task"
	With .Chart
		.LevelCount = 2
		.PaneWidth(0) = 56
		.ScrollRange(exStartDate) = "1/1/2001"
		.ScrollRange(exEndDate) = "1/31/2001"
		.FirstVisibleDate = "1/12/2001"
	End With
	With .Items
		h = .AddItem("Task 1")
		.AddBar h,"Task","1/15/2001","1/18/2001","K1"
		h = .AddItem("Task 1")
		.AddBar h,"Task","1/5/2001","1/11/2001","K1"
	End With
End With
You can use the Items.ItemBar(exBarMinStart) or Items.ItemBar(exBarMaxStart)
to specify the minimum and maximum range for starting point of specified bar,
while Items.ItemBar(exBarMinEnd) or Items.ItemBar(exBarMaxEnd) to specify the
minimum and maximum range for ending point of specified bar.
Simple call the ShellExecute API function when AnchorClick
event is called. In case you need to execute an application or a command and
wait until it is finsihed, you can use the following VB sample. The sample uses
the CreateProcess API function to create a application and WaitForSingleObject
API function to wait until the application is closed.
Public Sub ShellExecute(ByVal command As String)
    Dim proc As PROCESS_INFORMATION
    Dim START As STARTUPINFO
    Dim ret As Long
    START.cb = Len(START)
    ret = CreateProcessA(0&, command, 0&, 0&, 1&, &H20&, 0&, 0&, START, proc)
    If ret Then
        ret = WaitForSingleObject(proc.hProcess, -1)
    End If
    CloseHandle (proc.hProcess)
End Sub
You simple needs to call ShellExecute "notepad", so the code will continue
only after closing the notepad tool.
The definitions:
Private Type STARTUPINFO
cb As Long
lpReserved As String
lpDesktop As String
lpTitle As String
dwX As Long
dwY As Long
dwXSize As Long
dwYSize As Long
dwXCountChars As Long
dwYCountChars As Long
dwFillAttribute As Long
dwFlags As Long
wShowWindow As Integer
cbReserved2 As Integer
lpReserved2 As Long
hStdInput As Long
hStdOutput As Long
hStdError As Long
End Type

Private Type PROCESS_INFORMATION
hProcess As Long
hThread As Long
dwProcessID As Long
dwThreadID As Long
End Type

Private Declare Function WaitForSingleObject Lib "kernel32" (ByVal _
hHandle As Long, ByVal dwMilliseconds As Long) As Long

Private Declare Function CreateProcessA Lib "kernel32" (ByVal _
lpApplicationName As Long, ByVal lpCommandLine As String, ByVal _
lpProcessAttributes As Long, ByVal lpThreadAttributes As Long, _
ByVal bInheritHandles As Long, ByVal dwCreationFlags As Long, _
ByVal lpEnvironment As Long, ByVal lpCurrentDirectory As Long, _
lpStartupInfo As STARTUPINFO, lpProcessInformation As _
PROCESS_INFORMATION) As Long

Private Declare Function CloseHandle Lib "kernel32" (ByVal hObject As Long) As Long
The Items.SelectableItem property does the trick, so the item becomes
unselectable. In this case, the user can not click it, with mouse or the
keyboard. The following sample makes the first visible item unselectable:
With G2antt1.Items
    .SelectableItem(.FirstVisibleItem) = False
End With
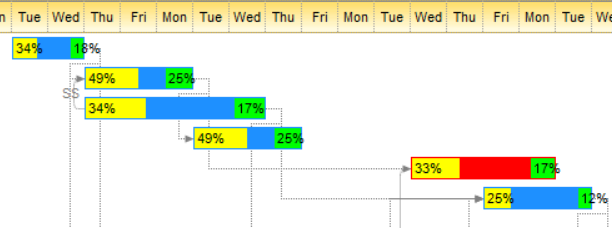
The eXG2antt control provides Overlaid
feature that allows you to arrange the bars so they do not intersect one with
another, when they are hosted by the same item, and they share the same period
of time. When OverlaidType property includes the exOverlaidBarsStack option it
requires changing the height of the item when necessary, and so the control must
have ScrollBySingleLine property on True, so you can vertically scroll all the
items.
The following C# sample arranges the Task bars vertically when they share the
same period of time, so they do not intersect:
Currently, the Overlaid feature supports the following types:
exOverlaidBarsOffset, The overlaid bars are shown using a different
vertical offset.
exOverlaidBarsIntersect, The overlaid portion is shown using a different
type of bar.
exOverlaidBarsStack, The bars that covers each other are shown as a stack.
This option changes the height of the item so the bars that covers each
other are displayed entirely.
The SelectedObjects
property retrieves a collection of bars and links being selected.
The following VB sample displays the name of the bars being selected ( /COM ):
    Dim c As Variant
    With G2antt1
        For Each c In .Items.SelectedObjects(exSelectBarsOnly)
            Debug.Print .ExecuteTemplate("Items.ItemBar(" & c & "," & exBarName & ")")
        Next
    End With
In the /NET assembly you can use the Items.get_ItemBar
or Items.set_ItemBar to access properties of the bar giving its handle and
key. The key of the bar is contained between " characters so if you
are using the ItemBar property make sure that you are removing the "
characters from start and end position. The get_SelectedObjects property
retrieves an array of string objects. If the string starts with the "
character it means that it is a link, else it is a bar. The name of the link is
contained between " characters, while the bar information contains the
handle of the item and the key of the bar as (item,"key"), where the
item is the handle of the item, while the key is the key of the bar.
The following C# sample changes the color of the selected bar(s) ( /NET ):
private void exg2antt1_ChartSelectionChanged(object sender)
{
    foreach (string o in exg2antt1.Items.get_SelectedObjects(exontrol.EXG2ANTTLib.SelectObjectsEnum.exSelectBarsOnly) as Array)
    {
        String[] b = o.Split(",".ToCharArray());
        exg2antt1.Items.set_BarColor( int.Parse(b[0]), b[1].Substring(1,b[1].Length -2), Color.Red );
    }
}
The following C# sample changes the color of the selected link(s) ( /NET )::
private void exg2antt1_ChartSelectionChanged(object sender)
{
    foreach (string o in exg2antt1.Items.get_SelectedObjects(exontrol.EXG2ANTTLib.SelectObjectsEnum.exSelectLinksOnly) as Array)
    {
        exg2antt1.Items.set_Link(o.Substring(1, o.Length - 2), exontrol.EXG2ANTTLib.LinkPropertyEnum.exLinkColor, ColorTranslator.ToWin32(Color.Red));
    }
}
The following VB.NET sample changes the color of the selected bar(s) ( /NET
)::
Private Sub Exg2antt1_ChartSelectionChanged(ByVal sender As System.Object) Handles Exg2antt1.ChartSelectionChanged
    Dim o As String
    For Each o In Exg2antt1.Items.get_SelectedObjects(exontrol.EXG2ANTTLib.SelectObjectsEnum.exSelectBarsOnly)
        Dim b As String() = o.Split(",".ToCharArray())
        Exg2antt1.Items.set_BarColor(CInt(b(0)), b(1).Substring(1, b(1).Length - 2), Color.Red)
    Next
End Sub
The following VB.NET sample changes the color of the selected link(s) ( /NET
)::
Private Sub Exg2antt1_ChartSelectionChanged(ByVal sender As System.Object) Handles Exg2antt1.ChartSelectionChanged
    Dim o As String = ""
    For Each o In Exg2antt1.Items.get_SelectedObjects(exontrol.EXG2ANTTLib.SelectObjectsEnum.exSelectLinksOnly)
        Exg2antt1.Items.set_Link(o.Substring(1, o.Length - 2), exontrol.EXG2ANTTLib.LinkPropertyEnum.exLinkColor, ColorTranslator.ToWin32(Color.Red))
    Next
End Sub
The newer versions of the /NET version provides the get_SelectedBars and
get_SelectedLinks properties that returns a collection of selected bars and
links.
The following C# sample changes the color of the selected bar(s) ( /NET )::
private void exg2antt1_ChartSelectionChanged(object sender)
{
    List<exontrol.EXG2ANTTLib.Items.SelectedBar> sBars = exg2antt1.Items.get_SelectedBars();
    if (sBars != null)
        foreach (exontrol.EXG2ANTTLib.Items.SelectedBar bar in sBars)
            exg2antt1.Items.set_BarColor(bar.Item, bar.Key, Color.Red);
}
The following C# sample changes the color of the selected link(s) ( /NET )::
private void exg2antt1_ChartSelectionChanged(object sender)
{
    List<string> sLinks = exg2antt1.Items.get_SelectedLinks();
    if (sLinks != null)
        foreach (string link in sLinks)
            exg2antt1.Items.set_Link(link, exontrol.EXG2ANTTLib.LinkPropertyEnum.exLinkColor, ColorTranslator.ToWin32(Color.Red));
}
The following VB.NET sample changes the color of the selected bar(s) ( /NET
)::
Private Sub Exg2antt1_ChartSelectionChanged(ByVal sender As System.Object) Handles Exg2antt1.ChartSelectionChanged
    With Exg2antt1
        Dim sBars As List(Of exontrol.EXG2ANTTLib.Items.SelectedBar) = .Items.get_SelectedBars()
        If Not (sBars Is Nothing) Then
            Dim bar As exontrol.EXG2ANTTLib.Items.SelectedBar
            For Each bar In sBars
                .Items.set_BarColor(bar.Item, bar.Key, Color.Red)
            Next
        End If
    End With
End Sub
The following VB.NET sample changes the color of the selected link(s) ( /NET
)::
Private Sub Exg2antt1_ChartSelectionChanged(ByVal sender As System.Object) Handles Exg2antt1.ChartSelectionChanged
    With Exg2antt1
        Dim sLinks As List(Of String) = .Items.get_SelectedLinks()
        If Not (sLinks Is Nothing) Then
            Dim link As String
            For Each link In sLinks
                .Items.set_Link(link, exontrol.EXG2ANTTLib.LinkPropertyEnum.exLinkColor, ColorTranslator.ToWin32(Color.Red))
            Next
        End If
    End With
End Sub
Generally you get "Class
not registered (Exception from HRESULT: 0x80040154 (REGDB_E_CLASSNOTREG))"
if you are using the 32-bit version of the /COM or "Unable
to load DLL : The specified module could not be found. (Exception from
HRESULT: 0x8007007E)", or "System.BadImageFormatException:
An attempt was made to load a program with an incorrect format. (Exception from
HRESULT: 0x8007000B)", if are using the 32-bit version of the /NET
assembly, on a Windows 64-bit edition. You need to build the 32-bit version of
your installer to install only the 32-bit edition of the components, and 64-bit
version of the installer to use the 64-bit edition of the components.
You can use an internal counter being set on zero at the start, increase its
value just before calling the BeginUpdate, and decrease the counter after
EndUpdate method is called. So, the handler of the BarResize event checks first
if the counter is zero, and ignore the event if it is not zero as in the
following template:
iCounter = 0
....
iCounter = iCounter + 1
with G2antt
	.BeginUpdate()

	....

	.EndUpdate()
end with
iCounter = iCounter - 1

Sub G2antt_BarResize(...)
if ( iCounter = 0 ) then
	....
end if
End Sub
This way the BarResize event is not executed during BeginUpdate/EndUpdate
methods, so change the value of the iCounter inside your code whenever you need
to execute code of a specified event. You should also check, if the FreezeEvents method is available.
If you would debug the application, you will notice that the Refresh method
is called each time a bar is added, which makes the time to load the items and
bars slower. I was thinking that the BarResize is called only when performing
operations over the control's UI, such moving a bar. No. The BarResize event is
called any time the starting or ending point of the bar is being changed. In
order to check when the user performs an operation on control's UI, you can use
the ChartStartChanging and ChartEndChanging events (
exMoveBar, exResizeStartBar, exResizeEndBar , and so on ). In this case, you
need to disable the BarResize event using a counter, or removing the delegate
using the -= operator and so the code should look as follow:
exg2antt1.BarResize -= new exontrol.EXG2ANTTLib.exg2antt.BarResizeEventHandler(this.exg2antt1_BarResize);
exg2antt1.BeginUpdate();
AddItems(10);
exg2antt1.EndUpdate();
Application.DoEvents();
exg2antt1.BarResize += new exontrol.EXG2ANTTLib.exg2antt.BarResizeEventHandler(this.exg2antt1_BarResize);

private void exg2antt1_BarResize(object sender, int Item, object Key)
{
    exg2antt1.Refresh();
}
This way the BarResize event is called only when the user performs a change
in the chart over the bars, after loading the items and bars. The code removes
the BarResize handler before calling the BeginUpdate, and attaching after
calling the EndUpdate method. The Application.DoEvents()
call makes sure that all events are performed before attaching the BarResize
handler to the control. A similar method exists in VB6 named DoEvents, while in
C++ you can manage using the following function:
The control provides up to 3 scroll bars. The vertical scroll bar is displayed
on the right side of the control ( RightToLeft property is False ) and it
scrolls the items, rows ( nodes ). The other 2 scroll bars are visible in the
bottom side of the control and are for scrolling the
columns section and the chart area. Use the ScrollBars
property to specify the scroll bars being shown in the control. The ScrollBar
property indicates whether the horizontal scroll bar being shown in the chart
section is visible or hidden.
vertical scroll bar. Use the methods such us: Scroll,
ScrollPos,
EnsureVisibleItem
to scroll vertically the control ( scroll vertically the rows, items or
nodes )
horizontal scroll bar. Use the methods such us: Scroll,
ScrollPos,
EnsureVisibleColumn
to scroll horizontally the control ( scrolls horizontally the columns
section ).
chart scroll bar. Use the methods such us: Chart.ScrollTo,
FirstVisibleDate
to browse for a new date ( scrolls horizontally the chart area, so a new
range of dates are being displayed )
The control fires the CreateBar
event when a new bar is added. Using this event you can remove the bar being
created on certain condition as in the following sample:
Private Sub G2antt1_CreateBar(ByVal Item As EXG2ANTTLibCtl.HITEM, ByVal DateStart As Date, ByVal DateEnd As Date)
    With G2antt1.Items
        If (.ItemParent(Item) = 0) Then
            .RemoveBar Item, "newbar"
        End If
    End With
End Sub
The sample prevents creating new bars in the root items ( the item with no
parents, ItemParent property gets 0 ). Newer versions, prevents creating
the new bars inside disabled items ( Items.EnableItem property on False )
The Items.ItemBar(exBarCanMoveToAnother)
property specifies whether the user can move bars from an item to another in
other words changing the parent item of the bar. The control fires the BarParentChange
event whenever a bar changes its parent item. The Cancel parameter ( passed by
reference ) of this event can be used to prevent or allow changing the parent of
the bar.
The following sample prevents moving bars to items with no parents
Private Sub G2antt1_BarParentChange(ByVal Item As EXG2ANTTLibCtl.HITEM, ByVal Key As Variant, ByVal NewItem As EXG2ANTTLibCtl.HITEM, Cancel As Boolean)
    With G2antt1.Items
        Cancel = .ItemParent(NewItem) = 0
    End With
End Sub
So, the Cancel parameter is set on True, if the item has no parent, so the
bar can not be moved to giving item, or it is false, if the item has parent
item. Shortly, the Cancel parameter is passed by reference so you can control
whenever you allow or prevent changing the parent item of the
bar.
In some AX environments ( such as dBase, uniPaas, formerly known as eDeveloper
), you can not change the parameters passed by reference, still the control
provides the EventParam
property that can help you to change the parameters passed by reference, so in
this case the similar event would be:
Private Sub G2antt1_BarParentChange(ByVal Item As EXG2ANTTLibCtl.HITEM, ByVal Key As Variant, ByVal NewItem As EXG2ANTTLibCtl.HITEM, Cancel As Boolean)
    With G2antt1.Items
        G2antt1.EventParam(3) = .ItemParent(NewItem) = 0
    End With
End Sub
The BarParentChange
event is fired every time the bar's parent is changing during the drag and drop
operation. The Cancel parameter ( byref ) of the BarParentChange event can be
changed to True or False, if the NewItem parameter indicates a good new parent
for your bar. For instance, you can cancel moving the bar to an item that
contains no parent items, as the one that could display summary bars, and so on.
You can use the GetAsyncKeyState API function to determine whether the left
mouse button is pressed or released as in the following VB sample
Private Const VK_LBUTTON = &H1
Private Declare Function GetAsyncKeyState Lib "user32" (ByVal vKey As Long) As Integer

Private Sub G2antt1_BarParentChange(ByVal Item As EXG2ANTTLibCtl.HITEM, ByVal Key As Variant, ByVal NewItem As EXG2ANTTLibCtl.HITEM, Cancel As Boolean)
    If Not (GetAsyncKeyState(VK_LBUTTON) < 0) Then
        Cancel = True
    End If
End Sub
The sample lets the bar being moved to any possible parent in the chart, but
it cancels the moving operation once the user releases the mouse. This is
possible because the BarParentChange is finally fired when the user releases the
left mouse button. The ItemBar(exBarParent) property of the Items object
determines the handle of the item that hosts the bar.
The following VB sample disables moving the bar to an item that contains no parent
( root items ):
Private Sub G2antt1_BarParentChange(ByVal Item As EXG2ANTTLibCtl.HITEM, ByVal Key As Variant, ByVal NewItem As EXG2ANTTLibCtl.HITEM, Cancel As Boolean)
    Cancel = G2antt1.Items.ItemParent(NewItem) = 0
End Sub
The ItemParent property of the Items collection indicates the handle of the
parent of the item. If the ItemParent property is 0, it indicates a root item.
The following VB sample displays the current parent, the new parent, and
start and end points of the bar being moved:
Private Sub G2antt1_BarParentChange(ByVal Item As EXG2ANTTLibCtl.HITEM, ByVal Key As Variant, ByVal NewItem As EXG2ANTTLibCtl.HITEM, Cancel As Boolean)
    With G2antt1.Items
        Debug.Print "Current parent: " & .CellCaption(Item, 0)
        Debug.Print "New parent: " & .CellCaption(NewItem, 0)
        Debug.Print "Start Date: " & .ItemBar(Item, Key, exBarStart)
        Debug.Print "End Date: " & .ItemBar(Item, Key, exBarEnd)
    End With
End Sub
The Item and Key parameters indicates the bar being moved. The NewItem
parameter indicates the handle of the parent of the bar, once it is moved,
Cancel parameter is False.
Starting with the version 8.0, the control supports Fit-To-Page feature,
using the FitToPage = On option as explained here.
The following VB sample changes the UnitWidth
property of the eXG2ant's Chart
object so, the entire chart is printed to a single page:
With Print1
    Dim l As Long
    With G2antt1.Chart
        l = .UnitWidth
        .UnitWidth = (Print1.ClientWidth - .PaneWidth(False)) / .CountVisibleUnits()
    End With
    Set .PrintExt = G2antt1.Object
    .Preview
    G2antt1.Chart.UnitWidth = l
End With
The equivalent sample in dBASE Plus is:
local oPrint,oG2antt
oPrint = form.exprint.nativeObject
oG2antt = form.Activex1.nativeObject

local l
l = oG2antt.Chart.UnitWidth
oG2antt.Chart.UnitWidth = (oPrint.ClientWidth() - oG2antt.Chart.PaneWidth(.f.)) / oG2antt.Chart.CountVisibleUnits()

oPrint.PrintExt = form.Activex1.nativeObject
oPrint.Preview()

oG2antt.Chart.UnitWidth = l
The sample has the disadvantage that once the user changes the Page's setup
during Previewing the code is not re-executed, so the chart is displayed as it
is on the screen. In order to update the UnitWidth property once the page's
setup is changed, we need to handle the Refreshing and
Refresh events
of the eXPrint component as shown
in the following VB sample:
Dim nUnitWidth As Long

Private Sub Print1_Refreshing()
    With G2antt1.Chart
        nUnitWidth = .UnitWidth
        .UnitWidth = (Print1.ClientWidth - .PaneWidth(False)) / .CountVisibleUnits()
    End With
End Sub

Private Sub Print1_Refresh()
    G2antt1.Chart.UnitWidth = nUnitWidth
End Sub

Private Sub Preview_Click()
    With Print1
        Set .PrintExt = G2antt1.Object
        .Preview
    End With
End Sub
The sample changes the UnitWidth property of the Chart
during the Refreshing event, so the chart fits to page, and restores the
UnitWidth's value when the Refresh event is invoked.
The following
VB/NET sample changes the UnitWidth property so the chart fits to page:
Dim nUnitWidth As Long

Private Sub Exprint1_RefreshingEvent(ByVal sender As System.Object) Handles Exprint1.RefreshingEvent
    With Exg2antt1.Chart
        nUnitWidth = .UnitWidth
        .UnitWidth = (Exprint1.ClientWidth - .get_PaneWidth(False)) / .CountVisibleUnits()
    End With
End Sub

Private Sub Exprint1_RefreshEvent(ByVal sender As System.Object) Handles Exprint1.RefreshEvent
    Exg2antt1.Chart.UnitWidth = nUnitWidth
End Sub

Private Sub Preview_Click(ByVal sender As System.Object, ByVal e As System.EventArgs) Handles Preview.Click
    Exprint1.PrintExt = Exg2antt1
    Exprint1.Preview()
End Sub
The exBarStart
property indicates the starting date of the bar, while the exBarEnd indicates
the ending point of the bar. The exBarPercent or exBarPercent100 indicates the
percent to display the progress inside the bar. The 0 value corresponds to the
exBarStart, while 1 corresponds to the exBarEnd, so the formula
Items.ItemBar(exBarStart) + (Items.ItemBar(exBarEnd)-Items.ItemBar(exBarStart))*Items.ItemBar(exBarPercent)
determines exactly the date time where progress bar is in the chart.
Yes, it is possible. Please check the ResizeUnitScale
and ResizeUnitCount
properties of the Chart object that allow to specify a different resizing
time-scale unit when the user resizes, moves or drags bars. The UnitScale
property of the Chart determines the the unit scale being displayed in the
chart. In this particular case, the Chart.UnitScale property is exHour, so the
Chart.ResizeUnitScale property should be exMinute, and the Chart.ResizeUnitCount
property should be 5, so the user will be able to move, resizes or drag up to
5 minutes.
The Items.ItemBar(exBarColor)
property specifies the color to show the particular bar, so for instance, if
the bar uses EBN files to display its content, you can use the exBarColor
property to define EBN with different colors as seen above.
The following VB sample changes the color for the "Task"
bar in the second item:
With G2antt1
	.Chart.FirstVisibleDate = #1/1/2001#
	.Columns.Add "Column"
	With .Items
		.AddBar .AddItem("Item 1"),"Task",#1/2/2001#,#1/4/2001#,"B1"
		h = .AddItem("Item 2")
		.AddBar h,"Task",#1/4/2001#,#1/6/2001#,"B2"
		.ItemBar(h,"B2",exBarColor) = 255
		.AddBar .AddItem("Item 3"),"Task",#1/6/2001#,#1/14/2001#,"B3"
	End With
End With
The following C# sample apply RED color to an EBN "Task" bar:
There are several alternatives to assign text, icons, pictures to any bar. The
control supports built-in HTML format, that includes the <img>
tag which is able to display icons, pictures or EBN files. For instance, the
"<img>5</img>" displays the icon with the index 5, while
the "<img>pic1</img>" displays a custom size picture
with the key pic1.
Use the Images
method or ReplaceIcon
property to add new icons to the control's images collection.
The HTMLPicture
property adds a picture that can be used in HTML strings, using the <img>
tag.
Before displaying a picture / icon, you have to use any of these methods to
load the icon or the picture to be used in the <img> tag. The <img>
supports displaying also EBN files as <img>16777216<img> displays
the EBN with the index 1 ( the 16777216 is actually the 0x1000000 )
Here is the options you have to assign icons, text, pictures to a bar:
Items.ItemBar(exBarCaption)
property retrieves or sets a value that indicates the caption being
assigned to the bar. Use the exBarHAlignCaption and exBarVAlignCaption to
align horizontally / vertically the caption in the bar.
Items.ItemBar(exBarExtraCaption)
property assign multiple captions to a bar at once. Use the
exBarExtraCaptionHAlign to specify the horizontal alignment of the extra
caption being added. Use the exBarExtraCaptionHOffset to specify the
horizontal offset to move the extra caption relative to its default
position. Use the exBarExtraCaptionVAlign to specify the vertical
alignment of the extra caption being added. Use the
exBarExtraCaptionVOffset to specify the vertical offset to move the extra
caption relative to its default position.
Notes.Add
method adds notes / boxes associated with BARs or DATEs. The RelativePosition
property always specifies the position of the starting part of the note
relative to the DATE or BAR being associated. Use the PartHOffset
/ PartVOffset
property to specify the horizontal / vertical offset relative to the start
or end part.
All these option supports built-in HTMLformat, so you can use the <img>
tag to include your picture.
The Exontrol's eXImages
tool may encode EBN files too. Run the eXImages tool and drop the EBN file to
the middle panel, the the right panel displays the BASE64 encoded string that
can be used in EBN functions ( VisualAppearance.Add property )
By default, the control displays the header, the scroll bars, buttons, and so
on using the current theme. The UseVisualTheme
property specifies whether the control uses the current visual theme to
display certain UI parts.
If you need parts of the current visual theme to be displayed in your bars,
objects of the control, you can use a code as follow (XP:Header
1 2):
With G2antt1
	.VisualAppearance.Add 1,"XP:Header 1 2"
	With .Chart
		.FirstVisibleDate = #1/1/2001#
		.Bars.Item("Task").Color = &H1000000
	End With
	.Columns.Add "Tasks"
	With .Items
		.AddBar .AddItem("Task 1"),"Task",#1/2/2001#,#1/4/2001#
		.AddBar .AddItem("Task 2"),"Task",#1/5/2001#,#1/7/2001#
	End With
End With
The sample displays "Task" bars using the
current visual aspect of the HEADER class, for HP_HEADERITEM on state
HIS_NORMAL.
The DateTickerLabel
property does the trick. The property has effect only if the DrawDateTicker
property is True, and the DateTickerLabel property is not empty. The
DateTickerLabel message is being displayed as soon as the user moves or
resizes a bar, and it displays new starting and ending points for the moving /
resizing bar.
Your application can provide some options to help user while performing
moving or resizing at runtime as follow:
grid
lines, that can be shown only when moving or resizing, using the
ChartStartChanging and ChartEndChanging events
select
date, to specify the margins of the are you what to highlight
ticker,
that shows the cursor's position in the chart, or while resizing, it shows
the size and the position of the bar
ability to specify a resizing/moving
unit, different that the displayed one ie while the chart displays
days, you can specify the resizing unit on hours.
inside
zoom, that can be used to magnify the portion of the chart being
selected
The Items.ItemBar(exBarToolTip) property provides a HTML text to be shown when
the cursor hovers the bar. Also, you can use the ShowToolTip
method display a custom tooltip. Use the ToolTipPopDelay
property specifies the period in ms of time the ToolTip remains visible if the
mouse pointer is stationary within a control. Use the ToolTipFont
property to change the tooltip's font. Use the Background(exToolTipAppearance)
property indicates the visual appearance of the borders of the tooltips. Use
the Background(exToolTipBackColor)
property indicates the tooltip's background color. Use the Background(exToolTipForeColor)
property indicates the tooltip's foreground color. The ShowToolTip method has
no effect if the ToolTip and Title parameters are empty. Use the CellToolTip
property to specify the cell's tooltip. Use the Link(,exLinkToolTip)
property to specify the tooltip to be shown when the cursor hovers the link.
Use the PartToolTip
property to assign a tooltip to a note.
The following VB sample assigns a tooltip to a bar:
With G2antt1
	.Columns.Add "Task"
	.Chart.FirstVisibleDate = #1/1/2001#
	With .Items
		h = .AddItem("Task 1")
		.AddBar h,"Task",#1/2/2001#,#1/4/2001#,"K1"
		.ItemBar(h,"K1",exBarToolTip) = "This is a bit of text that's displayed when the cursor hovers the bar"
	End With
End With
The OLEDropMode
property of the control must be set on exOLEDropManual (1). If this property is
set, the control fires the OLEDragDrop
event which notifies that the user drags data to the control. The Files
collection holds a collection of files being dragged.
The following VB sample copies the original icon being displayed in
Windows Explorer and displays it on the control:
Private Declare Function SHGetFileInfo Lib "shell32.dll" Alias "SHGetFileInfoA" (ByVal pszPath As String, ByVal dwFileAttributes As Long, psfi As SHFILEINFO, ByVal cbFileInfo As Long, ByVal uFlags As Long) As Long
Private Const SHGFI_OPENICON = &H2                       '  get open icon
Private Const SHGFI_SMALLICON = &H1                      '  get small icon
Private Const SHGFI_SYSICONINDEX = &H4000
Private Const SHGFI_ICON = &H100                         '  get icon
Private Const MAX_PATH = 260
Private Type SHFILEINFO
        hIcon As Long                      '  out: icon
        iIcon As Long          '  out: icon index
        dwAttributes As Long               '  out: SFGAO_ flags
        szDisplayName As String * MAX_PATH '  out: display name (or path)
        szTypeName As String * 80         '  out: type name
End Type
Private iIcon As Long
Private Sub Form_Load()
    iIcon = 1
    With G2antt1
        .BeginUpdate
            .OLEDropMode = exOLEDropManual
            .FullRowSelect = False
            .DefaultItemHeight = 18
            .Columns.Add "Icons"
        .EndUpdate
    End With
End Sub
Private Sub G2antt1_OLEDragDrop(ByVal Data As EXG2ANTTLibCtl.IExDataObject, Effect As Long, ByVal Button As Integer, ByVal Shift As Integer, ByVal X As Single, ByVal Y As Single)
    With Data.Files
        If (.Count > 0) Then
            For i = 0 To .Count - 1
                With G2antt1
                    Dim g As SHFILEINFO
                    .BeginUpdate
                    SHGetFileInfo Data.Files.Item(i), 0, g, Len(g), SHGFI_ICON Or SHGFI_SMALLICON
                    .ReplaceIcon g.hIcon
                    .Items.CellImage(G2antt1.Items.AddItem(Data.Files.Item(i)), 0) = iIcon
                    iIcon = iIcon + 1
                    .EndUpdate
                End With
            Next
        End If
    End With
End Sub
Private Sub G2antt1_OLEDragOver(ByVal Data As EXG2ANTTLibCtl.IExDataObject, Effect As Long, ByVal Button As Integer, ByVal Shift As Integer, ByVal X As Single, ByVal Y As Single, ByVal State As Integer)
    If (Data.Files.Count = 0) Then
        Effect = 0
    End If
End Sub
The sample uses the SHGetFileInfo API function to retrieve the handle of the
icon ( HICON ) to be copied and displayed in the control.
Set the the Chart.DrawDateTicker
property on False, when before calling the Show method of the ContextMenuStrip
object, and restore the DrawDateTicker property after calling the Show method.
The ItemBar
property changes a property for one or several bars as follow:
All bars in the chart, if the Item parameter is 0, and the Key
parameter is "<*>". For
instance, the ItemBar(0,"<*>",exBarColor) = RGB(255,0,0) changes the
color for all bars in the chart.
All bars in the chart that match a specified pattern using wild
characters as *,?,# or [], if the Item parameter is 0, and the Key
parameter is of "<pattern>" format, where the pattern
specifies the mask to search keys for. For
instance, the ItemBar(0,"<K*>",exBarColor) = RGB(255,0,0) changes the
color for all bars in the chart that starts with K.
All bars in the item, if the Item parameter is not 0, and the Key
parameter is "<*>". For
instance, the ItemBar(FirstVisibleItem,"<*>",exBarColor) = RGB(255,0,0) changes the
color for all bars in the first visible item
All bars in the item that match a specified pattern using wild
characters as *,?,# or [], if the Item parameter is not 0, and the Key
parameter is of "<pattern>" format, where the pattern
specifies the mask to search keys for. For
instance, the ItemBar(FirstVisibleItem,"<K*>",exBarColor) = RGB(255,0,0) changes the
color for all bars in the first visible item that starts with K.
In any other case, the ItemBar changes the property for specified key.
The following VB sample changes the color for all bars that starts with B:
With G2antt1
	.Columns.Add "Task"
	.Chart.FirstVisibleDate = #1/1/2001#
	.Chart.PaneWidth(False) = 64
	.Debug = True
	With .Items
		h = .AddItem("Task 1")
		.AddBar h,"Task",#1/2/2001#,#1/4/2001#,"A"
		.AddBar h,"Task",#1/5/2001#,#1/7/2001#,"B1"
		.AddBar h,"Task",#1/8/2001#,#1/17/2001#,"B2"
		.AddBar .AddItem("Task 2"),"Task",#1/2/2001#,#1/4/2001#,"K3"
		.AddBar .AddItem("Task 4"),"Task",#1/2/2001#,#1/4/2001#,"B4"
		.ItemBar(0,"<B*>",exBarColor) = 255
	End With
End With
Newer versions, allows you to use Auto-Numbering format like explained here.
The ItemPosition
property determines the position of the item in the parent's child collection.
The FormatColumn
event is fired before displaying a cell, so you can handle the FormatColumn to
display anything on the cell at runtime. This way you can display the row
position, you can display the value using the currency format, and so on. The FireFormatColumn
property allows the control to fire the FormatColumn event for the column. The Position
property specifies the position of the column.
If your chart does not display a tree or a hierarchy this property
is ok to be used with FormatColumn event to display the position
The following VB sample handles the FormatColumn event to display the row position:
Private Sub G2antt1_FormatColumn(ByVal Item As EXG2ANTTLibCtl.HITEM, ByVal ColIndex As Long, Value As Variant)
    Value = G2antt1.Items.ItemPosition(Item)
End Sub
If your chart displays a tree or a hierarchy the position of the item must
be determined relative to the FirstVisibleItem
as shown in the following VB sample:
Private Sub G2antt1_FormatColumn(ByVal Item As EXG2ANTTLibCtl.HITEM, ByVal ColIndex As Long, Value As Variant)
    Value = G2antt1.ScrollPos(True) + RelPos(Item)
End Sub

Private Function RelPos(ByVal hVisible As Long) As Long
    With G2antt1.Items
        Dim h As Long, i As Long, n As Long
        i = 0
        n = .VisibleCount + 1
        h = .FirstVisibleItem
        While (i <= n) And h <> 0 And h <> hVisible
            i = i + 1
            h = .NextVisibleItem(h)
        Wend
        RelPos = i
    End With
End Function
The ItemBar(exBarSelected)
property specifies whether a bar is selected. The
ItemBar(0,"<*>",exBarSelected) = False changes the exBarSelected
attributes for all bars in the chart.
The following VB/NET procedure unselects all selected bars:
If Not IsNothing(CF.GanttMain.Items.get_SelectedBars) Then
            For Each i In CF.GanttMain.Items.get_SelectedBars
                CF.GanttMain.Items.set_ItemBar(i.Item, i.Key, ItemBarPropertyEnum.exBarSelected, False)
            Next
End If
Thanks to Gunter Van Damme, Purna who submitted the note.
Here are the options you can use to export the control's content:
Use the Copy
method to export the control's content to the clipboard in Enhanced Metafile
(EMF) format. You can paste the clipboard to Word, Excel or any other OLE
application.
Use the CopyTo
method to save the control's content to a file in EMF format. The Enhanced
Metafile format is a 32-bit format that can contain both vector information
and bitmap information. This format is an improvement over the Windows
Metafile Format and contains extended features: Built-in scaling
information, Built-in descriptions that are saved with the file ,
Improvements in color palettes and device independence, and so on. You can
get the binary format using the CopyTo method by passing empty string for
file parameter.
Use the Exontrol's eXPrint
component to print the control's content to a PDF virtual printer. A PDF
virtual printer is a device that's installed as a printer but it is able to
save the listing to a PDF format.
Newer versions, may provide also the Export method.
The user can do one of the following in order to select a bar in the chart:
Click the bar, and so the bar is being selected. The previously selected
bar/link is unselected.
CTRL + click the bar to toggle the selection state of the bar. The
selection state for the previously selected bar stays unchanged.
Click any empty area in the chart, moves the mouse down or up so a
semi-transparent rectangle is shown to select the bars from this area. If
you move the mouse right or left the creating bars cursor may appear, and
this is happen if you allow creating the bars by dragging at runtime.
Right click the chart area and start dragging the semi-transparent
rectangle to select the bars from area.
If you want to limit just a margin of the chart, you can handle the DateChange
event to specify the correct value for the FirstVisibleDate property of the
Chart object like in the following sample:
Private Function Max(a, b)
    If (a < b) Then
        Max = b
    Else
        Max = a
    End If
End Function

Private Sub G2antt1_DateChange()
    With G2antt1
        Dim dLimit As Date
        dLimit = #1/1/2010#
        .Chart.FirstVisibleDate = Max(dLimit, .Chart.FirstVisibleDate)
        .ScrollPartEnable(exHChartScroll, exLeftBPart) = .Chart.FirstVisibleDate > dLimit
    End With
End Sub
The sample limits the FirstVisibleDate property of the chart so it won't be
less than January 1st of 2010, and disables the left scroll button in the chart
if FirstVisibleDate property is at limit.
The most probably the problem is that on one machine the date-time are read
correctly, while on the other is not, and this is happen due different settings
for Date-Time in the control panel. We would suggest checking the following:
check the type for DateStart and DateEnd parameters of the AddBar method.
If this is not of DateTime type, make sure that the values being used are
correctly formatted on the machine with the problem. For instance, the
string "1/2/2001" on a machine with English DateTime set indicates
the January the 2nd, while on a German machine, it means February the 1st.
check the Regional and Language options on your machine and the other
machine. This way you can see the difference.
Suggestion: Use the DateTime type ( or equivalent for your developing
language ) for DateStart/DateEnd parameters of the AddBar method of Items
objects.
If you want to provide customization for different languages you can use the XML
fashion way. In other words, you can use the SaveXML
method to saves an empty chart. An empty chart is defined as a chart
with no columns, so only regional settings are saved. So all you need to do is
to change all properties you need to be saved, and then call SaveXML to save the
changes to a XML file. Later you can call the LoadXML
method to load the previously saved document. Since you have saved the XML data
with no columns, only regional changes will be loaded.
If you want you can create a simple project that contains
Private Sub Command1_Click()
    G2antt1.SaveXML App.Path & "\default.xml"
    G2antt2.LoadXML App.Path & "\default.xml"
End Sub

Private Sub Form_Load()
    G2antt1.Chart.LevelCount = 2
    G2antt1.Chart.UnitScale = exDay

    PropertiesList1.AllowSpin = True
    PropertiesList1.Add "Level 0", G2antt1.Chart.Level(0), EditObject
    PropertiesList1.Add "Level 1", G2antt1.Chart.Level(1), EditObject
    PropertiesList1.Add "Chart", G2antt1.Chart, EditObject
    PropertiesList1.Add "Font", G2antt1.Font, EditObject
End Sub
The sample calls the SaveXML method for the first gantt
control ( empty ), and load the XML data to the second, so you can see the
changes. Using the eXPropertiesList control you can change the properties of the
first gantt control.
The control fires the FilterChange
event when the the user applies a new filter or closes the filter bar. The
FilterType
property of the Column determines whether a new filter is applied or if the
property is set to exAll for all columns, the filter bar has been closed.
The following VB sample displays a message when the user closes the control's
filter bar:
Private Sub G2antt1_FilterChange()
    For Each c In G2antt1.Columns
        If (c.FilterType <> exAll) Then
            Debug.Print "Apply Filter"
            Exit Sub
        End If
    Next
    Debug.Print "Close Filter"
End Sub
The OverviewZoom
event is called once the user clicks the scale buttons in the control's overview
area. The UnitScale
property specifies the new selected time scale. The problem is that the control
is trying to center the chart's view once the event is performed, so actually your
FirstVisibleDate
call during the event is ignored. The solution is using a timer so, changing the
chart's FirstVisibleDate occurs right after finishing the event.
Here's what you need to do for a /WPF C# application:
Declare a timer member as follow:
System.Windows.Threading.DispatcherTimer d = null;
Initializes the timer member at the end of the OverviewZoom event as follows:
d = new System.Windows.Threading.DispatcherTimer();
d.Tick += new EventHandler(d_Tick);
d.Interval = new TimeSpan(100);
d.Start();
Add the Tick event for the timer member as follows:
The bars with Items.ItemBar(exBarSelectable) = False, are not found when using
the Chart.BarFromPoint method by design. Thought, you will be able to find also
the not-exBarSelectable bars if you
Get the handle of the item from the point, using the ItemFromPoint method
If any item found, use the Items.FirstBarItem, Items.NextBarItem methods
to remove the exBarSelectable flag,
Call the Chart.BarFromPoint method to get the bar from the point
Restore the exBarSelectable flag for bars being changed
The following VB sample displays the key of the bar from the point, even if
that bar has exBarSelectable flag on False:
' MouseMove event - Occurs when the user moves the mouse.
Private Sub G2antt1_MouseMove(Button As Integer, Shift As Integer, X As Single, Y As Single)
    With G2antt1
        Dim h As Long, c As Long, hit As HitTestInfoEnum
        h = .ItemFromPoint(-1, -1, c, hit)
        If (h <> 0) Then
            Dim k As Variant, cK As New Collection
            With .Items
                k = .FirstItemBar(h)
                Do While Not IsEmpty(k)
                    If Not .ItemBar(h, k, exBarSelectable) Then
                        .ItemBar(h, k, exBarSelectable) = True
                        ' Saves the bars with the exBarSelectable flag set
                        cK.Add k
                    End If
                    k = .NextItemBar(h, k)
                Loop
            End With

            Debug.Print (.Chart.BarFromPoint(-1, -1))

            ' Restores the exBarSelectable flag
            With .Items
                For Each k In cK
                    .ItemBar(h, k, exBarSelectable) = False
                Next
            End With
        End If
    End With
End Sub
Here are a few options to remove the selected items in the control:
Use the RemoveSelection method of the Items object
to remove the selected items (including the descendents) (available starting from version 23.0)
Collects the items to be removed, using the Items.SelectCount and
Items.SelectedItem properties. Once the collection is completed, you can
call the Items.RemoveItem for each element being found (method 1)
While the Items.SelectCount property is greater than 0, call the
Items.RemoveItem( Items.SelectedItem(0) ), so removes the first selected
item until all released (method 2)
The following VB sample shows the method 1:
Private Sub removeSelection1()

    Dim i As Long, h As Variant
    Dim cItems As New Collection

    G2antt1.BeginUpdate
    With G2antt1.Items
        For i = 0 To .SelectCount - 1
            cItems.Add .SelectedItem(i)
        Next
        For Each h In cItems
            .RemoveItem h
        Next
    End With
    G2antt1.EndUpdate

End Sub
The following VB sample shows the method 2:
Private Sub removeSelection2()

    G2antt1.BeginUpdate
    With G2antt1.Items
        While .SelectCount > 0
            .RemoveItem .SelectedItem(0)
        Wend
    End With
    G2antt1.EndUpdate

End Sub
The VisibleItemCount property of the Items object returns the number of items
being filtered. The following sample displays the number of items after the user
applies a filter.
' FilterChange event - Occurs when the filter was changed.
Private Sub G2antt1_FilterChange()
	With G2antt1
		.FilterBarCaption = .Items.VisibleCount
	End With
End Sub
The VisibleCount property returns the number of visible items ( those who fit
the control's client area ). The ItemCount property returns the total number of
items.
By default, the selected items erases the colors for items. The SelBackColor
property indicates the background color for selected items. Here's few things
you can consider in order to see the colors of the items:
You can use a transparent EBN to be displayed for selected items, using
the SelBackColor property.
If your list contains several columns, you can use the FullRowSelect
property on 0 or 1, so not the entire item is changing the background when
the item is selected.
efore calling the EnsureVisibleItem method.
For /NET you should use the Application.DoEvents method. For Delphi, you should
use the Application.ProcessMessages.
There are the several ways of enumerating the
items/cells in the control. The following samples
are in VB, but they can be easily converted to any other
programming language. This samples shows you an idea how
easily you can enumerate through the items.
A). Using the GetItems method of the control. The
GetItems method gets the items as they are displayed,
sorted and filtered to an array or vector. Also, the GetItems method collect
the child items as well, no matter if the parent item is
collapsed. The GetItems method returns an array. For
instance, if your control contains 1 column, the
GetItems will retrieves a one-dimensional
array. A 2 columns will get a two-dimensional
array, an so on. You can use the PutItems method to
insert the array to the control.
B). Using the for each statement for Items
property of the control. The Items property gets a
collection of items as they were added. This method lists
the items by index not by their positions. The items is represented
by handles, so the handle can be used in the Cell properties
to refer the cell. For instance,
Items.CellCaption(Handle,Column) gets the cell from the Item
with the specified handle on specified column. The following
sample displays the cells in the first column as they were
added:
With G2antt1
        Dim h As Variant
        For Each h In .Items
            Debug.Print .Items.CellCaption(h, 0)
        Next
End With
If you need to access multiple columns add the Debug.Print
.Items.CellCaption(h, 1), Debug.Print .Items.CellCaption(h,
2) ... for each column you require.
C). A similar approach to B is using the
Items.ItemCount and Items.ItemByIndex properties. This method
lists the items by index not by their positions.
With G2antt1
    Dim i As Long
    With .Items
        For i = 0 To .ItemCount - 1
            Debug.Print .CellCaption(.ItemByIndex(i), 0)
        Next
    End With
End With
The Items. ItemByIndex retrieves the handle of the item
giving its index. For instance, the first added item has the
index 0, the second added item has the index 1, and so on.
D). Using the Items.NextVisibleItem property. This
method gets the items as they are displayed, sorted and
filtered.
With G2antt1
    With .Items
        Dim h As Long
        h = .RootItem(0)
        While Not h = 0
            Debug.Print .CellCaption(h, 0)
            h = .NextVisibleItem(h)
        Wend
    End With
End With
E). Using the Items.ItemChild and
Items.NextSiblingItem property. This method enumerates recursively
the items and its children. This
method gets the items as they are displayed, sorted and
filtered, including the children items that are not visible
aka parent item is collapsed.
With G2antt1
    With .Items
        For i = 0 To .RootCount - 1
            RecItem G2antt1, .RootItem(i)
        Next
    End With
End With
Sub RecItem(ByVal c As Object, ByVal h As Long)
If Not(h = 0) Then
Dim hChild As Long
With c.Items
Debug.Print .CellCaption(h, 0)
hChild = .ItemChild(h)
While Not (hChild = 0)
RecItem c, hChild
hChild = .NextSiblingItem(hChild)
Wend
End With
End If
End Sub
The SingleSel property specifies whether the control supports single or multiple
selected items. If the SingleSel property is True ( by default ), the user can
select a single item/row only. The Items.FocusItem property indicates the handle
of the item that has the focus. The FocusColumnIndex property indicates the
index of the column that has the focus. The Cell of Items.FocusItem that belongs
to the FocusColumnIndex column, defines the active or the focused cell. The
control fires the SelectionChanged event when the control's selection is
changed. The FocusChanged event occurs when the active cell is changed, in other
words when the Items.FocusItem and/or FocusColumnIndex property is changed. The
SelectCount property specifies the count of selected items/rows. If the
SingleSel property is True, the SelectCount property can be 0 or 1.
The following code displays the active or focused value:
Private Sub G2antt1_FocusChanged()
    With G2antt1.Items
        Debug.Print .CellCaption(.FocusItem, G2antt1.FocusColumnIndex)
    End With
End Sub
The following code displays the selected values:
Private Sub enumSelection(ByVal g As Object)
    With g.Items
        For i = 1 To .SelectCount
            Debug.Print .CellCaption(.SelectedItem(i - 1), 0)
        Next
    End With
End Sub

Private Sub G2antt1_SelectionChanged()
    enumSelection G2antt1
End Sub
As the control supports multiple columns, the following code displays the
selected values for all columns:
Private Sub enumSelection(ByVal g As Object)
    With g.Items
        Dim nColumns As Long
        nColumns = g.Columns.Count
        For i = 1 To .SelectCount
            Dim h As HITEM
            h = .SelectedItem(i - 1)
            For j = 1 To nColumns
                Debug.Print .CellCaption(h, j - 1)
            Next
        Next
    End With
End Sub

Private Sub G2antt1_SelectionChanged()
    enumSelection G2antt1
End Sub
Here's some ideas on how you can use arrays with the
control.
A). Using the GetItems/PutItems to get or put the
items/cells using arrays. The GetItems method gets the
items/cells of the control to a safe array. The PutItems
inserts the array of values to the control. For instance the
following sample adds 3 columns and 1001 items from an
array:
/COM version
With G2antt1
    .Columns.Add "C1"
    .Columns.Add "C2"
    .Columns.Add "C3"
    Dim v(2, 1000) As String
    v(1, 10) = "zece"
    .PutItems v
End With
In VB the arrays is zero-based, so 2 indicates actually
0, 1 and 2 ( 3 columns ).
/NET or /WPF version
With Exg2antt1
    .Columns.Add("C1")
    .Columns.Add("C2")
    .Columns.Add("C3")
    Dim v(2, 1000) As String
    v(1, 10) = "zece"
    .PutItems(v)
End With
B1). You can use the PutItems method to insert a
hierarchy, for single-column control. The following sample
adds a hierarchy as Root\Child 1, Child 2\SubChild 1,
SubChild 2
/COM version
With G2antt1
    .LinesAtRoot = exLinesAtRoot
    .Columns.Add "Nodes"
    .PutItems Array("Root", Array("Child 1", "Child 2", Array("SubChild 1", "SubChild 2")))
End With
/NET or /WPF version
With Exg2antt1
    .LinesAtRoot = exontrol.EXG2ANTTLib.LinesAtRootEnum.exLinesAtRoot
    .Columns.Add("Nodes")
    .PutItems(New Object() {"Root", New Object() {"Child 1", "Child 2", New Object() {"SubChild 1", "SubChild 2"}}})
End With
B2). You can use the PutItems method to insert a
hierarchy, for single-column control, as child items. The following sample
adds an item New, and a sub-hierarchy Root\Child 1, Child 2\SubChild 1,
SubChild 2
/COM version
With G2antt1
    .LinesAtRoot = exLinesAtRoot
    .Columns.Add "Nodes"
    .PutItems Array("Root", Array("Child 1", "Child 2", Array("SubChild 1", "SubChild 2"))), .Items.AddItem("new")
End With
/NET or /WPF version
With Exg2antt1
    .LinesAtRoot = exontrol.EXG2ANTTLib.LinesAtRootEnum.exLinesAtRoot
    .Columns.Add("Nodes")
    .PutItems(New Object() {"Root", New Object() {"Child 1", "Child 2", New Object() {"SubChild 1", "SubChild 2"}}}, .Items.AddItem("new"))
End With
C). You can use the arrays to fill a
multiple-columns control in Items.AddItem/Items.InsertItem
methods as in the following sample:
/COM version
With G2antt1
    .Columns.Add "C1"
    .Columns.Add "C2"
    .Columns.Add "C3"
    With .Items
        .AddItem Array("Cell 1.1", "Cell 1.2", "Cell 1.3")
        .AddItem Array("Cell 2.1", "Cell 2.2", "Cell 2.3")
    End With
End With
/NET or /WPF version
With Exg2antt1
    .Columns.Add("C1")
    .Columns.Add("C2")
    .Columns.Add("C3")
    With .Items
        .AddItem(New Object() {"Cell 1.1", "Cell 1.2", "Cell 1.3"})
        .AddItem(New Object() {"Cell 2.1", "Cell 2.2", "Cell 2.3"})
    End With
End With
This is a trick that can be used to simulate a left mouse button when right
mouse button is clicked ( so the same thing you can do using the left and right
mouse buttons )
Private Const WM_LBUTTONDOWN = &H201
Private Const WM_LBUTTONUP = &H202
Private Declare Function PostMessage Lib "user32" Alias "PostMessageA" (ByVal hwnd As Long, ByVal wMsg As Long, ByVal wParam As Long, ByVal lParam As Long) As Long
Private Declare Function GetDlgItem Lib "user32" (ByVal hDlg As Long, ByVal nIDDlgItem As Long) As Long
Private Declare Function ClientToScreen Lib "user32" (ByVal hwnd As Long, lpPoint As POINTAPI) As Long
Private Declare Function ScreenToClient Lib "user32" (ByVal hwnd As Long, lpPoint As POINTAPI) As Long
Private Type POINTAPI
        x As Long
        y As Long
End Type

Private Sub G2antt1_MouseDown(Button As Integer, Shift As Integer, x As Single, y As Single)
    With G2antt1
        If (Button = 2) Then
            Dim p As POINTAPI
            p.x = x / Screen.TwipsPerPixelX
            p.y = y / Screen.TwipsPerPixelY
            ClientToScreen .hwnd, p
            ScreenToClient GetDlgItem(.hwnd, 33024), p
            PostMessage GetDlgItem(.hwnd, 33024), WM_LBUTTONDOWN, 0, p.x + 65536 * p.y
        End If
    End With
End Sub
In other languages you do not need the TwipsPerPixel properties. They are
required n VB6 just to convert twips to pixels. Instead, you can use the
GetMessagePos to retrieve the position of the last UI operation.
If you need simulating releasing the left mouse button also you need to add
the code (for instance, let's say you need to be able to select a bar using the
right mouse button too):
Private Sub G2antt1_MouseUp(Button As Integer, Shift As Integer, x As Single, y As Single)
    With G2antt1
        If (Button = 2) Then
            Dim p As POINTAPI
            p.x = x / Screen.TwipsPerPixelX
            p.y = y / Screen.TwipsPerPixelY
            ClientToScreen .hwnd, p
            ScreenToClient GetDlgItem(.hwnd, 33024), p
            PostMessage GetDlgItem(.hwnd, 33024), WM_LBUTTONUP, 0, p.x + 65536 * p.y
        End If
    End With
End Sub
If you are using the /NET assembly you can use the following sample:
Private Const WM_LBUTTONDOWN = &H201
Private Const WM_LBUTTONUP = &H202
<DllImport("user32.dll", SetLastError:=True, CharSet:=CharSet.Auto)> _
Private Shared Function PostMessage(ByVal hWnd As IntPtr, ByVal Msg As UInteger, ByVal wParam As IntPtr, ByVal lParam As IntPtr) As Boolean
End Function
<DllImport("user32.dll", CharSet:=CharSet.Auto, ExactSpelling:=True)> _
Public Shared Function GetDlgItem(ByVal hWnd As IntPtr, ByVal nIDDlgItem As Integer) As IntPtr
End Function
<DllImport("user32.dll", CharSet:=CharSet.Auto, ExactSpelling:=True)> _
Public Shared Function ClientToScreen(ByVal hWnd As IntPtr, <[In](), Out()> ByRef pt As Point) As Integer
End Function
<DllImport("user32.dll", CharSet:=CharSet.Auto, SetLastError:=True, ExactSpelling:=True)> _
Public Shared Function ScreenToClient(ByVal hWnd As IntPtr, <[In](), Out()> ByRef pt As Point) As Integer
End Function

Private Sub Exg2antt1_MouseDownEvent(ByVal sender As System.Object, ByVal Button As System.Int16, ByVal Shift As System.Int16, ByVal X As System.Int32, ByVal Y As System.Int32)
	Handles Exg2antt1.MouseDownEvent
    With Exg2antt1
        If (Button = 2) Then
            Dim p As Point
             p.X = X
             p.Y = Y
             ClientToScreen(.hWnd, p)
             ScreenToClient(GetDlgItem(.hWnd, 33024), p)
             PostMessage(GetDlgItem(.hWnd, 33024), WM_LBUTTONDOWN, 0, p.X + 65536 * p.Y)
         End If
     End With
End Sub

Private Sub Exg2antt1_MouseUpEvent(ByVal sender As System.Object, ByVal Button As System.Int16, ByVal Shift As System.Int16, ByVal X As System.Int32, ByVal Y As System.Int32)
	Handles Exg2antt1.MouseUpEvent
   With Exg2antt1
       If (Button = 2) Then
           Dim p As Point
           p.X = X
           p.Y = Y
           ClientToScreen(.hWnd, p)
           ScreenToClient(GetDlgItem(.hWnd, 33024), p)
           PostMessage(GetDlgItem(.hWnd, 33024), WM_LBUTTONUP, 0, p.x + 65536 * p.y)
       End If
  End With
End Sub
Yes. There are several ways to show vertical lines or zones in the chart area as
follows:
Chart.MarkTodayColor property retrieves or sets a value that indicates the
color to mark today in the chart. This option show 2 vertical lines to
indicate where Today is in the chart.
Chart.MarkNowColor property (and related ) specifies the background
color or the visual appearance of the object that indicates the current time
in the chart. This can be used to let the control updates the current time
in your chart. For instance, you can add a vertical line that is updated
every second.
Chart.AllowSelectDate ( and related ) indicate whether the user can select
or unselects dates in the chart. This option show a date selected using a
different background or visual appearance. You can use the Chart.SelectDates
to select and mark dates at runtime. You can select zones or hard-coded
dates and you can allow user changes or not the selected dates.
Chart.MarkTimeZone ( and related ) method highlights the giving time- zone from start to end with a different background
UI attributes such as color, EBN/Skin, pattern, transparency, HTML captions.
This option can be used to add your lines or zones to the chart with a
different color, appearance or with a HTML text inside hat could indicates a
cursor, a restrictive zone, or so.
You can always uses the ItemBar property of the Items object to specify
particular options for individual bars. The ItemBar does not provide any
StartShape/EndShape options instead you can use the exBarName to define the new
visual aspect of the bar, by defining the StartShape and EndShape properties, or
any common property in the Bar object.
The following VB6 sample defines the createBar function
which , if case, creates a new type of bar with specified StartShape and
EndShape arguments. Copy the following code to your project, run the form,
and right click a bar. The random shapes is assigned to the right-clicked
bar/item.
Private Function createBar(ByVal g As EXG2ANTTLibCtl.G2antt, ByVal s As EXG2ANTTLibCtl.ShapeCornerEnum, ByVal e As EXG2ANTTLibCtl.ShapeCornerEnum) As String
    Dim sBar As String
    sBar = "Task" & Hex(s) & Hex(e)
    With g.Chart.Bars
        If .Item(sBar) Is Nothing Then
            With .Copy("Task", sBar)
                .StartShape = s
                .EndShape = e
            End With
        End If
    End With
    createBar = sBar
End Function
The createBar creates a new bar with specified StartShape/EndShape only if
the bar with the same name is not already created. The function can be easily adapted
to your needs.
The following sample VB6 changes the StartShape / EndShape to random values when
the user right clicks a bar or item:
Private Sub G2antt1_MouseUp(Button As Integer, Shift As Integer, X As Single, Y As Single)
    If (Button = 2) Then
        Dim i As Long, c As Long, hit As HitTestInfoEnum
        i = G2antt1.ItemFromPoint(-1, -1, c, hit)
        If (i <> 0) Then
            With G2antt1.Items
                .ItemBar(i, G2antt1.Chart.BarFromPoint(-1, -1), exBarName) = createBar(G2antt1, 20 * Rnd(), 20 * Rnd())
            End With
        End If
    End If
End Sub
The equivalent samples in VB.NET are:
Private Function createBar(ByVal g As exontrol.EXG2ANTTLib.exg2antt, ByVal s As exontrol.EXG2ANTTLib.ShapeCornerEnum, ByVal e As exontrol.EXG2ANTTLib.ShapeCornerEnum) As String
    Dim sBar As String = "Task" & Hex(s) & Hex(e)
    With g.Chart.Bars
        If .Item(sBar) Is Nothing Then
            With .Copy("Task", sBar)
                .StartShape = s
                .EndShape = e
            End With
        End If
    End With
    createBar = sBar
End Function

Private Sub Exg2antt1_MouseUpEvent(ByVal sender As System.Object, ByVal Button As System.Int16, ByVal Shift As System.Int16,
	ByVal X As System.Int32, ByVal Y As System.Int32) Handles Exg2antt1.MouseUpEvent
    If (Button = 2) Then
        With Exg2antt1
            Dim i As Integer = .get_ItemFromPoint(-1, -1)
            If (i <> 0) Then
                .Items.set_ItemBar(i, .Chart.get_BarFromPoint(-1, -1), exontrol.EXG2ANTTLib.ItemBarPropertyEnum.exBarName, createBar(Exg2antt1, Rnd() * 20, Rnd() * 20))
            End If
        End With
    End If
End Sub
or in C# as follows:
private string createBar(exontrol.EXG2ANTTLib.exg2antt g, exontrol.EXG2ANTTLib.ShapeCornerEnum s, exontrol.EXG2ANTTLib.ShapeCornerEnum e)
{
    string sBar = "Task" + String.Format("{0:x}", s) + String.Format("{0:x}", e);
    if (g.Chart.Bars[sBar] == null)
    {
        exontrol.EXG2ANTTLib.Bar nBar = g.Chart.Bars.Copy("Task", sBar);
        nBar.StartShape = s;
        nBar.EndShape = e;
    }
    return sBar;
}
private void exg2antt1_MouseUpEvent(object sender, short Button, short Shift, int X, int Y)
{
    if (Button == 2)
    {
        int i = exg2antt1.get_ItemFromPoint(-1, -1);
        if (i != 0)
        {
            Random random = new Random();
            exg2antt1.Items.set_ItemBar(i, exg2antt1.Chart.get_BarFromPoint(-1, -1), exontrol.EXG2ANTTLib.ItemBarPropertyEnum.exBarName, createBar(exg2antt1,
            (exontrol.EXG2ANTTLib.ShapeCornerEnum)(random.Next(20)), (exontrol.EXG2ANTTLib.ShapeCornerEnum)(random.Next(20))));
        }
    }
}
In other words, the name of the bar is composed by a prefix plus the
StartShape and EndShape values, so anytime the bar with specified shapes is
required the control is using an already created bar or creates on time, the
required bar. So, it all depends on what you need and how you can defines you
type of bars.
The Chart.MarkSelectDateColor property may be used to specify the color or the
visual appearance of the selected dates as explained bellow. You can programmatically
select new dates using the SelectDate property of the Chart. You should use the
(get_/set_)MarkSelectDateColor32 for /NET or /WPF version
of the component.
The Chart.MarkSelectDateColor property changes the color or the visual
appearance of the selected dates as follows:
a simple RGB value indicates the color for vertical lines to be
shown for selected dates. For instance, Chart.MarkSelectDateColor = RGB(255,0,0)
shows the vertical lines for selected dates in red.
a value of format such as 0x7FBBGGRR or 0x7F000000 + RGB(RR,GG,BB) to show
the selected dates using solid colors, where the RR is the hexa value
of the Red, GG Green, and BB for Blue. For instance the Chart.MarkSelectDateColor = &H7f0000ff
specifies the selected dates to be shown with a solid red color.
using an EBN object, if the last 7 bits in the high
significant byte of the color indicates the identifier of the skin being
used to show the selected dates. For instance,
In conclusion, you need to use the 0x7F identifier ( or any inexistent EBN
object ), to show the selected dates using a solid color.
The following VB6 sample shows the selected dates using a solid pink color:
With G2antt1
.BeginUpdate
With .Chart
.PaneWidth(False) = 0
.FirstVisibleDate = #1/1/2008#
.MarkTodayColor = .BackColor
.LevelCount = 2
.MarkSelectDateColor = &H7F000000 + RGB(&HFF, &HC0, &HCB)
.SelectLevel = 1
.SelectDate(#1/15/2008#) = True
.SelectDate(#1/16/2008#) = True
End With
.EndUpdate
End With
or
With G2antt1
.BeginUpdate
With .Chart
.PaneWidth(False) = 0
.FirstVisibleDate = #1/1/2008#
.MarkTodayColor = .BackColor
.LevelCount = 2
.MarkSelectDateColor = &H7fcbc0ff
.SelectLevel = 1
.SelectDate(#1/15/2008#) = True
.SelectDate(#1/16/2008#) = True
End With
.EndUpdate
End With
The following VB.NET sample shows the selected dates using a solid pink
color:
With Exg2antt1
    .BeginUpdate()
    With .Chart
        .set_PaneWidth(False, 0)
        .FirstVisibleDate = #1/1/2008#
        .MarkTodayColor = .BackColor
        .LevelCount = 2
        .MarkSelectDateColor32 = &H7F000000 + RGB(&HFF, &HC0, &HCB)
        .SelectLevel = 1
        .set_SelectDate(#1/15/2008#, True)
        .set_SelectDate(#1/16/2008#, True)
    End With
    .EndUpdate()
End With
or
With Exg2antt1
	.BeginUpdate()
	With .Chart
		.set_PaneWidth(False,0)
		.FirstVisibleDate = #1/1/2008#
		.MarkTodayColor = .BackColor
		.LevelCount = 2
		.MarkSelectDateColor32 = &H7fcbc0ff
		.SelectLevel = 1
		.set_SelectDate(#1/15/2008#,True)
		.set_SelectDate(#1/16/2008#,True)
	End With
	.EndUpdate()
End With
The following C# sample shows the selected dates using a solid pink color:
The Items.AllowCellValueToItemBar property
allows you to associate a cell with a bar's property such as StartDate, EndDate,
and so on.
A bar is designed to be an interval from date A to date B. By definition, if
A is equal with B, nothing is displayed, so you have an empty bar. In some
cases, you require to consider an empty bar to be a single day. In this case,
there are two options to do that as listed:
Use the Chart.ShowEmptyBars property on 1 ( by default, the
Chart.ShowEmptyBars property is 0 ). This property indicates whether empty
bars are shown or not. By an empty bar we consider to be a bar that has the
same start and end point.
The following sample is provided to show you an idea on how you can do in
another way, if you require something more special:
Use the Column.FormatColumn property as "shortdate(date(value)-1)",
which indicates what you need to display in the column when the end date is
displayed.
If you assign an editor to the same column, the Items.CellValue is put on
the editor, so the value requires to be changed by doing the following:
Handle the EditOpen event to change the editing value when the control
goes in Edit mode
Handle the Change event to change the NewValue parameter to set the
value back to the control. Because, we need to change the value while
the control is in Edit mode, we use the Editing
property that gives the handle of the current editor or 0, if the
control is not in Edit mode.
Here's the VB6 sample you can use:
Private Declare Function SetWindowText Lib "user32" Alias "SetWindowTextA" (ByVal hwnd As Long, ByVal lpString As String) As Long
Private Declare Function SendMessage Lib "user32" Alias "SendMessageA" (ByVal hwnd As Long, ByVal wMsg As Long, ByVal wParam As Long, lParam As Any) As Long

Private sDate As String

Private Sub Timer1_Timer()
    Timer1.Enabled = False
    With G2antt1
        SetWindowText .Editing, sDate
        SendMessage .Editing, &HB1, 0, -1
    End With
End Sub

Private Sub G2antt1_EditOpen()
    With G2antt1
        With .Items
            sDate = .CellCaption(.FocusItem, G2antt1.FocusColumnIndex)
        End With
        Timer1_Timer
    End With
End Sub

Private Sub G2antt1_Change(ByVal Item As EXG2ANTTLibCtl.HITEM, ByVal ColIndex As Long, NewValue As Variant)
    If (G2antt1.Editing <> 0) Then
        sDate = CDate(CLng(CDate(NewValue)))
        NewValue = CDate(NewValue) + 1
        Timer1.Enabled = True
    End If
End Sub
Private Sub Form_Load()

    Timer1.Enabled = False
    Timer1.Interval = 10
End Sub
Here's the MS Access sample you can use:
Option Explicit
Option Compare Database

Private Declare Function SetWindowText Lib "user32" Alias "SetWindowTextA" (ByVal hwnd As Long, ByVal lpString As String) As Long
Private Declare Function SendMessage Lib "user32" Alias "SendMessageA" (ByVal hwnd As Long, ByVal wMsg As Long, ByVal wParam As Long, lParam As Any) As Long

Private sDate As String

Private Sub Form_Timer()
    TimerInterval = 0
    With G2antt1
        SetWindowText .Editing, sDate
        SendMessage .Editing, &HB1, 0, -1
    End With
End Sub

Private Sub G2antt1_EditOpen()
    With G2antt1
        With .Items
            sDate = .CellCaption(.FocusItem, G2antt1.FocusColumnIndex)
        End With
        Form_Timer
    End With
End Sub

Private Sub G2antt1_Change(ByVal Item As Long, ByVal ColIndex As Long, NewValue As Variant)
    If (G2antt1.Editing <> 0) Then
        sDate = CDate(CLng(CDate(NewValue)))
        NewValue = CDate(NewValue) + 1
        TimerInterval = 10
    End If
End Sub

Private Sub Form_Load()

    TimerInterval = 0

End Sub
The sample changes the value being edited while the control runs in the
Edit mode ( date - 1 ), and pass the date + 1, when the user changes the
value ( NewValue ) .
When using expressions you have to optimize the expression as much as possible.
The formula is optimized internally if using operations between constants, aka
1+ 2/3 * 4, the expression is evaluated once, and using the result all the time,
instead if the formula is complicated, the time to evaluate it could vary, and
that's why you should consider or review the formula. Using the expression let's
you the freedom to choose a large number of possibilities, but it does not mean
that the way you provide the formula does not matter in evaluation, like
explaining in the following scenarion:
For instance, let's say you have the formula:
"(date(value)<#06/06/2011 06.00.00#) or (date(value)>#06/06/2011 22.00.00# and date(value)<#06/07/2011 06.00.00#) or (date(value)>#06/07/2011 22.00.00# and date(value)<#06/08/2011 06.00.00#) or (date(value)>#06/08/2011 22.00.00# and date(value)<#06/09/2011 06.00.00#) or (date(value)>#06/09/2011 22.00.00# and date(value)<#06/10/2011 06.00.00#) or (date(value)>#06/10/2011 22.00.00# and date(value)<#06/13/2011 06.00.00#) or (date(value)>#06/13/2011 22.00.00# and date(value)<#06/14/2011 06.00.00#) or (date(value)>#06/14/2011 22.00.00# and date(value)<#06/15/2011 06.00.00#) or (date(value)>#06/15/2011 22.00.00# and date(value)<#06/16/2011 06.00.00#) or (date(value)>#06/16/2011 22.00.00# and date(value)<#06/17/2011 06.00.00#) or (date(value)>#06/17/2011 22.00.00# and date(value)<#06/18/2011 06.00.00#) or (date(value)>#06/18/2011 22.00.00# and date(value)<#06/19/2011 06.00.00#) or (date(value)>#06/19/2011 22.00.00# and date(value)<#06/20/2011 06.00.00#) or (date(value)>#06/20/2011 22.00.00# and date(value)<#06/21/2011 06.00.00#) or (date(value)>#06/21/2011 22.00.00# and date(value)<#06/22/2011 06.00.00#) or (date(value)>#06/22/2011 22.00.00# and date(value)<#06/23/2011 06.00.00#) or (date(value)>#06/23/2011 22.00.00# and date(value)<#06/24/2011 06.00.00#) or (date(value)>#06/24/2011 22.00.00# and date(value)<#06/25/2011 06.00.00#) or (date(value)>#06/25/2011 22.00.00# and date(value)<#06/26/2011 06.00.00#) or (date(value)>#06/26/2011 22.00.00# and date(value)<#06/27/2011 06.00.00#) or (date(value)>#06/27/2011 22.00.00# and date(value)<#06/28/2011 06.00.00#) or (date(value)>#06/28/2011 22.00.00# and date(value)<#06/29/2011 06.00.00#) or (date(value)>#06/29/2011 22.00.00# and date(value)<#06/30/2011 06.00.00#) or (date(value)>#07/06/2011 22.00.00# and date(value)<#07/07/2011 06.00.00#) or (date(value)>#07/07/2011 22.00.00# and date(value)<#07/08/2011 06.00.00#) or (date(value)>#07/08/2011 22.00.00# and date(value)<#07/09
/2011 06.00.00#) or (date(value)>#07/09/2011 22.00.00# and date(value)<#07/10/2011 06.00.00#) or (date(value)>#07/10/2011 22.00.00# and date(value)<#07/13/2011 06.00.00#) or (date(value)>#07/13/2011 22.00.00# and date(value)<#07/14/2011 06.00.00#) or (date(value)>#07/14/2011 22.00.00# and date(value)<#07/15/2011 06.00.00#) or (date(value)>#07/15/2011 22.00.00# and date(value)<#07/16/2011 06.00.00#) or (date(value)>#07/16/2011 22.00.00# and date(value)<#07/17/2011 06.00.00#) or (date(value)>#07/17/2011 22.00.00# and date(value)<#07/18/2011 06.00.00#) or (date(value)>#07/18/2011 22.00.00# and date(value)<#07/19/2011 06.00.00#) or (date(value)>#07/19/2011 22.00.00# and date(value)<#07/20/2011 06.00.00#) or (date(value)>#07/20/2011 22.00.00# and date(value)<#07/21/2011 06.00.00#) or (date(value)>#07/21/2011 22.00.00# and date(value)<#07/22/2011 06.00.00#) or (date(value)>#07/22/2011 22.00.00# and date(value)<#07/23/2011 06.00.00#) or (date(value)>#07/23/2011 22.00.00# and date(value)<#07/24/2011 06.00.00#) or (date(value)>#07/24/2011 22.00.00# and date(value)<#07/25/2011 06.00.00#) or (date(value)>#07/25/2011 22.00.00# and date(value)<#07/26/2011 06.00.00#) or (date(value)>#07/26/2011 22.00.00# and date(value)<#07/27/2011 06.00.00#) or (date(value)>#07/27/2011 22.00.00# and date(value)<#07/28/2011 06.00.00#) or (date(value)>#07/28/2011 22.00.00# and date(value)<#07/29/2011 06.00.00#) or (date(value)>#07/29/2011 22.00.00# and date(value)<#07/30/2011 06.00.00#) or (date(value)>#07/30/2011 22.00.00#)"
Instead using this you can use:
date(shortdate(value)) case(default: 1;#05/30/2011#:(hour(value) < 6 or hour(value) > 8) and (hour(value) < 14 or hour(value) > 22);)
In case you have multiple OR conditions use IN, SWITCH or CASE as much as
possible, as they are considerable fast then using the OR operator.
For instance, let's say that we have a formula with 1024 OR conditions. If
using the OR, the max time to evaluate the expression is 1024 * U, while using
the CASE for the same number of conditions, the time could be up to 8 * U, so it
may require maximum 8 evaluations, instead of 1024, which is considerable fast.
where U is the time to evaluate a condition.
The following link
shows the predefined functions you can use within an expression.
The BarParentChange
event notifies your application once the user moves a bar to another
parent/item. The BarParentChange occurs any time a new parent is selected during
the drag and drop operation. In order to simulate a Drop event, you need to
handle the ChartEndChanging
event, which notifies once the UI operation ends like in the following VB/NET
sample:
Dim iMoving As Long = 0
Dim bMoving As Object = Nothing

Private Sub Exg2antt1_BarParentChange(ByVal sender As Object, ByVal Item As Integer, ByVal Key As Object, ByVal NewItem As Integer, ByRef Cancel As Boolean) Handles Exg2antt1.BarParentChange
    iMoving = NewItem
    bMoving = Key
End Sub

Private Sub Exg2antt1_ChartEndChanging(ByVal sender As System.Object, ByVal Operation As exontrol.EXG2ANTTLib.BarOperationEnum) Handles Exg2antt1.ChartEndChanging
    If (Operation = exontrol.EXG2ANTTLib.BarOperationEnum.exMoveBar) Then
        If (iMoving <> 0) Then
            If Not (bMoving Is Nothing) Then
                MessageBox.Show(Exg2antt1.Items.get_CellCaption(Exg2antt1.Items.get_BarParent(iMoving, bMoving), 0)).ToString()
            End If
        End If
        iMoving = 0
        bMoving = Nothing
    End If
End Sub
The sample holds the bar being moved in the BarParentChange, and displays a
message box when the moving operation ends, in other words, when user drops the
bar to a new parent.
The Items.FirstLink
and Items.NextLink
properties can be used to enumerate the links in the chart.
The FirstLink property gets the key of the first link, while the NextLink
gives the next link based on the Key you pass as in the following VB sample.
With G2antt1.Items
    Dim k As Variant
    k = .FirstLink()
    While Not IsEmpty(k)
        Debug.Print "LinkKey = " & k
        k = .NextLink(k)
    Wend
End With
You can use the Items.Link
property to access a property of the link such as starting or ending item,
starting or ending bars. For instance, Items.Link(LinkStartItem) gets the handle
of the item where the link starts, and Items.Link(LinkStartBar) the key of the
bar where the link starts. As the handle is gerearted at runtime, you can use
the Items.ItemToIndex
property so, you have the Index and the Key which can be serialized. Next, on
loading, all you need is to have the starting/ending index and key of the bar
and use the AddLink
and Items.ItemByIndex
so you can get back the handle of the item based on its index.
In conclusion, if you plan to save/load the links you should consider the
following:
when saving the links, get the index of the item rather than handle being
returned by the Items.Link(LinkStartItem), and convert it to an index using
the Items.ItemToIndex method. The same for LinkEndItem option.
when loading the links, loads first all items, and once you done, loads
the link. Use the Items.ItemByIndex property to get the handle of the item
based on its handle, and call the AddLink to add new links the control.
The Items.FirstItemBar
and Items.NextItemBar
properties can be used to enumerate the bars in the chart.
The FirstItemBar property retrieves the key of the first bar, which is the bar with the lowest Z-Order, as bars are sorted alphabetically in ascending order by their keys.
The NextItemBar method returns the next bar in the sequence based on the key you provide, following the same alphabetical and Z-Order sorting, as shown in the following VB example.
With G2antt1
    If Not (h = 0) Then
        Dim k As Variant
        k = .Items.FirstItemBar(h)
        While Not IsEmpty(k)
            Debug.Print "Key = " & k
            k = .Items.NextItemBar(h, k)
        Wend
    End If
End With
Now, all you need is to enumerate the items within the control which simple
can be using the for each statement as in the following sample:
With G2antt1
    Dim h As Variant
    For Each h In .Items
        Dim k As Variant
        k = .Items.FirstItemBar(h)
        While Not IsEmpty(k)
            Debug.Print "Key = " & k & ", Item " & .Items.CellCaption(h, 0)
            k = .Items.NextItemBar(h, k)
        Wend
    Next
End With
In case you want to colorize/change the color for all bars in the chart, you
can use a code like:
The BarResize
event is fired any time the bar's starting or ending points is changed.
In order to get the bar being moved or resized by dragging, you need to
handle the following:
handle the ChartStartChanging
event, for operation like exMoveBar, exResizeStartBar or exResizeEndBar, and
store the bar and item from point for later use.
handle the ChartEndChanging
event, for operation like exMoveBar, exResizeStartBar or exResizeEndBar, and
check the data saved previously, and perform the operation you need.
This way you can get the bar being moved or resized by dragging.
Here's a snippet of code that get the bar being moved or resized:
Private itemChanging As Long
Private barChanging As Variant
Private Sub G2antt1_ChartStartChanging(ByVal Operation As EXG2ANTTLibCtl.BarOperationEnum)
    If (Operation = exMoveBar) Or (Operation = exResizeEndBar) Or (Operation = exResizeStartBar) Then
        Dim c As Long, hit As HitTestInfoEnum
        With G2antt1
            barChanging = .Chart.BarFromPoint(-1, -1)
            itemChanging = .ItemFromPoint(-1, -1, c, hit)
        End With
    End If
End Sub

Private Sub G2antt1_ChartEndChanging(ByVal Operation As EXG2ANTTLibCtl.BarOperationEnum)
    If (Operation = exMoveBar) Or (Operation = exResizeEndBar) Or (Operation = exResizeStartBar) Then
        If (Not IsEmpty(barChanging)) Then
            With G2antt1.Items
                Debug.Print "Bar Change: " & .ItemBar(itemChanging, barChanging, exBarName)
            End With
            barChanging = Empty
        End If
    End If
End Sub
where the itemChanging is a global member, that stores the handle of the item
where the bar change occurs. The barChanging member defines the key of the bar
being changed. The sample just holds the itemChanging and barChanging, and use
them when the moving or resizing operation ends ( ChartEndChanging event ).
The /COM version of the component provides the DataSource property, which can be
used to bound the control's view to a DAO recordset. By default, once you set
the DataSource property to a recordset, all changes you do on the control will
be updated in the associated recordset. Because the DAO object does not provide
any notifications or events the control is not able to detect any AddNew or
Delete method that has been called. Instead, the control provides the AddItem
and RemoveItem events that notifies your application once a new item is added to
the control, or when an item is deleted. Based on these events, you will be able
to manipulate the DAO recordset appropriate as in the following samples. In
addition, the control fires the Error event in case any error occurs when
handling the ADO or DAO recordsets, For instance, trying to update a read-only
field. In conclusion, if user changes a cell/value in the control, the
associated field in the recordset is automatically updated. If any error occurs
on updating the associated record, the Error event is fired which describes the
error.
Handling the AddNew method in the control, using the DAO recordset on MS
Access
Insert a Button and the Control to a form, and name them as cmdAddNew
and Grid1
Add the Form_Load event of the form with the following code:
Private Sub Form_Load()
    With G2antt1
        .BeginUpdate
            .DataSource = CurrentDb.OpenRecordset("Employees")
            .DetectAddNew = True
        .EndUpdate
    End With
End Sub
The code binds the control to a DAO recordset. Please notice, that the
DetectAddNew property is set after calling the DataSource method. Setting the
DetectAddNew property on True, makes the control associate new items with new
records added during the AddItem event as shown bellow.
Add the Click event of the cmdAddNew button with the following code
Private Sub cmdAddNew_Click()
    With G2antt1.Items
        .EnsureVisibleItem .AddItem
    End With
End Sub
The code adds a new item to the control and ensures that the new item fits
the control's client area. The Items.AddItem call makes the control to fire
the AddItem event, which will actually add the new record to the database, as
in the following code
Add the AddItem event of the Control with the following code:
Private Sub G2antt1_AddItem(ByVal Item As Long)
    With G2antt1
        If .DetectAddNew Then
            With .DataSource
                .AddNew
                !Lastname = "new"
                !FirstName = "new"
                .Update
            End With
        End If
    End With
End Sub
The code adds a new record to the bounded recordset. Here you need to
insert or update the required fields so the new record is added to the DAO
recordset. Once the event is finished, the new item is associated with the new
record in the database, so from now on, any change to the item will be
reflected in the recordset.
Handling the Delete method in the control, using the DAO recordset on MS
Access
Insert a Button and the Control to a form, and name them as cmdRemove
and G2antt1
Add the Form_Load event of the form with the following code:
Private Sub Form_Load()
    With G2antt1
        .BeginUpdate
            .DataSource = CurrentDb.OpenRecordset("Employees")
            .DetectDelete = True
        .EndUpdate
    End With
End Sub
The code binds the control to a DAO recordset. The DetectDelete property on
True, makes the control to move the current record on the item to be deleted,
and to remove any reference to the record to be deleted.
Add the Click event of the cmdRemove button with the following code
Private Sub cmdRemove_Click()
    With G2antt1.Items
        .RemoveItem .FocusItem
    End With
End Sub
The code removes the focused item. The Items.RemoveItem call makes the
control to fire the RemoveItem event, which will actually delete the
associated record in the database, as in the following code
Add the RemoveItem event of the Control with the following code:
Private Sub G2antt1_RemoveItem(ByVal Item As Long)
    With G2antt1
        If .DetectDelete Then
            With .DataSource
                .Delete
            End With
        End If
    End With
End Sub
The code deletes the current record.
This sample just gives the basic idea of handling the AddNew/Delete methods
of the DAO recordset. You can customize the sample, so you can add or remove new
items by selecting items on a context menu, and so on.
The /COM version of the component provides the DataSource property, which can be
used to bound the control's view to an ADO recordset. By default, once you set
the DataSource property to a recordset, all changes you do on the control will
be updated in the associated recordset.
Handling the AddNew method in the control, using the ADO recordset in VB
Insert a Button and the Control to a form, and name them as cmdAddNew
and Grid1
Add the Form_Load event of the form with the following code:
Private Sub Form_Load()
    With G2antt1
        Set rs = CreateObject("ADOR.Recordset")
        With rs
            .Open "Employees", "Provider=Microsoft.ACE.OLEDB.12.0;Data Source=\sample.accdb", 3, 3
        End With
        .DataSource = rs
        .DetectAddNew = True
    End With
End Sub
The code binds the control to an ADO recordset.
Add the Click event of the cmdAddNew button with the following code
Private Sub cmdAddNew_Click()
    With G2antt1.DataSource
        .AddNew Array("FirstName", "LastName"), Array("new", "new")
        .Update
    End With
End Sub
The code adds a new record to the attached recordset, and the control will
add a new associated item, because the DetectAddNew method is True.
Handling the Delete method in the control, using the ADO recordset in VB
Insert a Button and the Control to a form, and name them as cmdRemove
and G2antt1
Add the Form_Load event of the form with the following code:
Private Sub Form_Load()
    With G2antt1
        Set rs = CreateObject("ADOR.Recordset")
        With rs
            .Open "Employees", "Provider=Microsoft.ACE.OLEDB.12.0;Data Source=\sample.accdb", 3, 3
        End With
        .DataSource = rs
        .DetectDelete = True
    End With
End Sub
The code binds the control to an ADO recordset.
Add the Click event of the cmdRemove button with the following code
Private Sub cmdRemove_Click()
    With G2antt1.DataSource
        .Delete
    End With
End Sub
The Delete method of the recordset removes the current record ( select a
new item to the control, and the current record is changed ), and due
DetectDelete the associated item is removed from the view.
This sample just gives the basic idea of handling the AddNew/Delete methods
of the ADO recordset. You can customize the sample, so you can add or remove new
items by selecting items on a context menu, and so on.
The /COM version of the component provides the DataSource property, which can be
used to bound the control's view to an ADO or DAO recordset. Once you assign the
control's DataSource property, the control's AddItem event is fired, and so you
can change the cell's icon / image once the control is tied to your data source.
The Images method of the control should be used to load the icons that your view
should display. The Items.CellImage or Items.CellImages property should be used
to assign a single or multiple icons to specified cell. The Items.CellValue
property specifies the cell's value.
The following VB6 sample loads 9 icons using the Images method, and change the
Items.CellImage property according to Items.CellValue during the AddItem event:
Private Sub G2antt1_AddItem(ByVal Item As EXG2ANTTLibCtl.HITEM)
    With G2antt1.Items
        .CellImage(Item, 1) = .CellValue(Item, 1)
    End With
End Sub

Private Sub Form_Load()
    With G2antt1
        .BeginUpdate
        Dim s As String
        s = "gBJJgBAIJAAOAAEAAQhYAf8Pf4hh0QihCJo2AEZjQAjEZFEaIEgjQBAAgjcZkMnlUrlktl0vmExmUzmk"
        s = s + "1m03nE5nU7nk9n0/oFBoVDolFo1HpFJpVLplNp1PqFRqVTqlVq1XrFZrVbrldr1fsFhsVjslls1ntFpt"
        s = s + "Vrtltt1vuFxuVzul1u13vF5vV7vl9v1/wGBwWDwmFw2HxGJxWLxmNx0wiETf+PylCyMsy+VzVEzObz03"
        s = s + "yOhh+f0kyzsn0+l1Wo0eY1ur2Guyep2O12233G53W73m932/4HB4XD4nF42l0WTrnJru0rXMrHOyVV6X"
        s = s + "SqHWqfV19e7FK7XKq/dqPf6nb1ngqXM8VU9dP6Hh0fvq3t5/m9n2jX0ov66/4jL+Pc/ymvI+7ZvjA70P"
        s = s + "LA0EwK6b5QU6bjwlCcKQrC0LwxDMNQ3DkOw9D8QM5AUGvVEcAwWsMAO9Ez0xZCDZObFz+wYrcVRfE8HQ"
        s = s + "RCL4Ro7kZOzH6jQJGsgqzGymSOn7TySy0dOXAUmJ7Ib5ydIkeyNKr6xQsEoxDL0vzBEKLB8lcyI8kSUJ"
        s = s + "GACSJOASdS6xZ/nAlR/nhOh8JUeA6JUYCEJOQAHpVQCVgPQlDJVQtEUFQM/0YjZgA/PI/zocE5UtSp4T"
        s = s + "rTVMnwf9O0/PVQjpPU+1KB0+0BVIH1VVlA0LV4AVhWVY1pWdbVrWNW11VYH0hXwP0geA/2FYg/0vY9M2"
        s = s + "TTVP09T1RVFU1TV3XdcVva1q2xWVp15VVf1/YtioCA=="
        .Images (s)

        Set rs = CreateObject("ADOR.Recordset")
        With rs
            .Open "Orders", "Provider=Microsoft.Jet.OLEDB.4.0;Data Source=\SAMPLE.MDB", 3, 3
        End With
        .DataSource = rs
        .EndUpdate
    End With
End Sub
The sample just gives a basic idea on how you can assign/change the cell's
icon based on the cell's value. Please change the \SAMPLE.MDB with the path of
your database. For instance: C:\Program Files\Exontrol\ExGrid\Sample\SAMPLE.MDB
The following
VBA/Access sample loads 9 icons using the Images method, and change the
Items.CellImage property according to Items.CellValue during the AddItem event:
Private Sub G2antt1_AddItem(ByVal Item As Long)
    With G2antt1.Items
        .CellImage(Item, 1) = .CellValue(Item, 1)
    End With
End Sub

Private Sub Form_Load()
    With G2antt1
        .BeginUpdate
        Dim s As String
        s = "gBJJgBAIJAAOAAEAAQhYAf8Pf4hh0QihCJo2AEZjQAjEZFEaIEgjQBAAgjcZkMnlUrlktl0vmExmUzmk"
        s = s + "1m03nE5nU7nk9n0/oFBoVDolFo1HpFJpVLplNp1PqFRqVTqlVq1XrFZrVbrldr1fsFhsVjslls1ntFpt"
        s = s + "Vrtltt1vuFxuVzul1u13vF5vV7vl9v1/wGBwWDwmFw2HxGJxWLxmNx0wiETf+PylCyMsy+VzVEzObz03"
        s = s + "yOhh+f0kyzsn0+l1Wo0eY1ur2Guyep2O12233G53W73m932/4HB4XD4nF42l0WTrnJru0rXMrHOyVV6X"
        s = s + "SqHWqfV19e7FK7XKq/dqPf6nb1ngqXM8VU9dP6Hh0fvq3t5/m9n2jX0ov66/4jL+Pc/ymvI+7ZvjA70P"
        s = s + "LA0EwK6b5QU6bjwlCcKQrC0LwxDMNQ3DkOw9D8QM5AUGvVEcAwWsMAO9Ez0xZCDZObFz+wYrcVRfE8HQ"
        s = s + "RCL4Ro7kZOzH6jQJGsgqzGymSOn7TySy0dOXAUmJ7Ib5ydIkeyNKr6xQsEoxDL0vzBEKLB8lcyI8kSUJ"
        s = s + "GACSJOASdS6xZ/nAlR/nhOh8JUeA6JUYCEJOQAHpVQCVgPQlDJVQtEUFQM/0YjZgA/PI/zocE5UtSp4T"
        s = s + "rTVMnwf9O0/PVQjpPU+1KB0+0BVIH1VVlA0LV4AVhWVY1pWdbVrWNW11VYH0hXwP0geA/2FYg/0vY9M2"
        s = s + "TTVP09T1RVFU1TV3XdcVva1q2xWVp15VVf1/YtioCA=="
        .Images (s)
        Set .DataSource = CurrentDb.OpenRecordset("Orders")
        .EndUpdate
    End With
End Sub
Open the C:\Program Files\Exontrol\ExGrid\Sample\SAMPLE.MDB
database
The /COM version of the component provides the DataSource property, which can be
used to bound the control's view to an ADO or DAO recordset. The Images method
of the control should be used to load the icons that your view should display.
Instead of Items.CellImage or Items.CellImages property you can use the <img>
HTML built-in tags to display one or more icons to each cell based on the value.
The method uses the Column.FormatColumn property to specify the format to be
displayed on the column such as <img>1</img> which means displaying
the icon with the index 1.
The following VB6 sample loads 9 icons using the Images method, and displays
an icon based on the cell's value.
Private Sub Form_Load()
    With G2antt1
        .BeginUpdate
        Dim s As String
        s = "gBJJgBAIJAAOAAEAAQhYAf8Pf4hh0QihCJo2AEZjQAjEZFEaIEgjQBAAgjcZkMnlUrlktl0vmExmUzmk"
        s = s + "1m03nE5nU7nk9n0/oFBoVDolFo1HpFJpVLplNp1PqFRqVTqlVq1XrFZrVbrldr1fsFhsVjslls1ntFpt"
        s = s + "Vrtltt1vuFxuVzul1u13vF5vV7vl9v1/wGBwWDwmFw2HxGJxWLxmNx0wiETf+PylCyMsy+VzVEzObz03"
        s = s + "yOhh+f0kyzsn0+l1Wo0eY1ur2Guyep2O12233G53W73m932/4HB4XD4nF42l0WTrnJru0rXMrHOyVV6X"
        s = s + "SqHWqfV19e7FK7XKq/dqPf6nb1ngqXM8VU9dP6Hh0fvq3t5/m9n2jX0ov66/4jL+Pc/ymvI+7ZvjA70P"
        s = s + "LA0EwK6b5QU6bjwlCcKQrC0LwxDMNQ3DkOw9D8QM5AUGvVEcAwWsMAO9Ez0xZCDZObFz+wYrcVRfE8HQ"
        s = s + "RCL4Ro7kZOzH6jQJGsgqzGymSOn7TySy0dOXAUmJ7Ib5ydIkeyNKr6xQsEoxDL0vzBEKLB8lcyI8kSUJ"
        s = s + "GACSJOASdS6xZ/nAlR/nhOh8JUeA6JUYCEJOQAHpVQCVgPQlDJVQtEUFQM/0YjZgA/PI/zocE5UtSp4T"
        s = s + "rTVMnwf9O0/PVQjpPU+1KB0+0BVIH1VVlA0LV4AVhWVY1pWdbVrWNW11VYH0hXwP0geA/2FYg/0vY9M2"
        s = s + "TTVP09T1RVFU1TV3XdcVva1q2xWVp15VVf1/YtioCA=="
        .Images (s)

        Set rs = CreateObject("ADOR.Recordset")
        With rs
            .Open "Orders", "Provider=Microsoft.Jet.OLEDB.4.0;Data Source=\SAMPLE.MDB", 3, 3
        End With
        .DataSource = rs
        With .Columns(1)
            .Def(exCellValueFormat) = exHTML
            .FormatColumn = "`<img>` + value + `</img>`"
        End With
        .EndUpdate
    End With
End Sub
This sample does not use the AddItem event, instead the cell's icon is
automatically updated once the cell's value. Please change the
\SAMPLE.MDB with the path of
your database. For instance: C:\Program Files\Exontrol\ExGrid\Sample\SAMPLE.MDB
The following
VBA/Access sample loads 9 icons using the Images method, and displays
an icon based on the cell's value.
Private Sub Form_Load()
    With G2antt1
        .BeginUpdate
        Dim s As String
        s = "gBJJgBAIJAAOAAEAAQhYAf8Pf4hh0QihCJo2AEZjQAjEZFEaIEgjQBAAgjcZkMnlUrlktl0vmExmUzmk"
        s = s + "1m03nE5nU7nk9n0/oFBoVDolFo1HpFJpVLplNp1PqFRqVTqlVq1XrFZrVbrldr1fsFhsVjslls1ntFpt"
        s = s + "Vrtltt1vuFxuVzul1u13vF5vV7vl9v1/wGBwWDwmFw2HxGJxWLxmNx0wiETf+PylCyMsy+VzVEzObz03"
        s = s + "yOhh+f0kyzsn0+l1Wo0eY1ur2Guyep2O12233G53W73m932/4HB4XD4nF42l0WTrnJru0rXMrHOyVV6X"
        s = s + "SqHWqfV19e7FK7XKq/dqPf6nb1ngqXM8VU9dP6Hh0fvq3t5/m9n2jX0ov66/4jL+Pc/ymvI+7ZvjA70P"
        s = s + "LA0EwK6b5QU6bjwlCcKQrC0LwxDMNQ3DkOw9D8QM5AUGvVEcAwWsMAO9Ez0xZCDZObFz+wYrcVRfE8HQ"
        s = s + "RCL4Ro7kZOzH6jQJGsgqzGymSOn7TySy0dOXAUmJ7Ib5ydIkeyNKr6xQsEoxDL0vzBEKLB8lcyI8kSUJ"
        s = s + "GACSJOASdS6xZ/nAlR/nhOh8JUeA6JUYCEJOQAHpVQCVgPQlDJVQtEUFQM/0YjZgA/PI/zocE5UtSp4T"
        s = s + "rTVMnwf9O0/PVQjpPU+1KB0+0BVIH1VVlA0LV4AVhWVY1pWdbVrWNW11VYH0hXwP0geA/2FYg/0vY9M2"
        s = s + "TTVP09T1RVFU1TV3XdcVva1q2xWVp15VVf1/YtioCA=="
        .Images (s)
        Set .DataSource = CurrentDb.OpenRecordset("Orders")
        With .Columns(1)
            .Def(EXGRIDLib.DefColumnEnum.exCellValueFormat) = EXGRIDLib.ValueFormatEnum.exHTML
            .FormatColumn = "`<img>` + value + `</img>`"
        End With
        .EndUpdate
    End With
End Sub
Open the C:\Program Files\Exontrol\ExGrid\Sample\SAMPLE.MDB
database
The /COM version of the component provides the DataSource property, which can be
used to bound the control's view to an ADO or DAO recordset. Once you assign the
control's DataSource property, the control's AddItem event is fired, and so you
can change the cell's picture once the control is tied to your data source. The
Items.CellPicture property can be used to assign a custom-size picture to a
cell. The following sample uses the HTMLPicture property just to hold a
collection of pictures, so we do not need to load a new picture for each cell,
in other words we assign the same reference to a picture for all cells with the
same picture, instead loading the same picture for different cells with the same
picture.
The following VB6 sample loads 9 pictures using the HTMLPicture property, and
change the Items.CellPicture property according to Items.CellValue during the
AddItem event:
Private Sub G2antt1_AddItem(ByVal Item As EXG2ANTTLibCtl.HITEM)
    With G2antt1.Items
        .CellPicture(Item, 1) = G2antt1.HTMLPicture(.CellValue(Item, 1))
    End With
End Sub

Private Sub Form_Load()
    With G2antt1
        .BeginUpdate
        For i = 1 To 9
            .HTMLPicture(i) = "\PICTURES\" & i & ".jpg"
        Next
        Set rs = CreateObject("ADOR.Recordset")
        With rs
            .Open "Orders", "Provider=Microsoft.Jet.OLEDB.4.0;Data Source=\SAMPLE.MDB", 3, 3
        End With
        .DataSource = rs
        .EndUpdate
    End With
End Sub
The sample just gives a basic idea on how you can assign/change the cell's
picture based on the cell's value. Please change the \SAMPLE.MDB with the path of
your database. For instance: C:\Program Files\Exontrol\ExGrid\Sample\SAMPLE.MDB. Also, please change the \PICTURES with the path where you can
locate the 1.jpg, 2.jpg, ..., 9.jpg
In addition, you can use the following properties:
DefaultItemHeight property to specify the default height for items to be
added.
Items.CellPictureWidth property to specify the width of the picture to be
displayed on the cell.
Items.CellPictureHeight property to specify the height of the picture to
be displayed on the cell.
The following VBA/Access sample loads 9 pictures using the HTMLPicture property, and
change the Items.CellPicture property according to Items.CellValue during the
AddItem event:
Private Sub G2antt1_AddItem(ByVal Item As Long)
    With G2antt1.Items
        .CellPicture(Item, 1) = G2antt1.HTMLPicture(.CellValue(Item, 1))
    End With
End Sub

Private Sub Form_Load()
    With G2antt1
        .BeginUpdate
        Dim i As Long
        For i = 1 To 9
            .HTMLPicture(i) = "\PICTURES\" & i & ".jpg"
        Next
        Set .DataSource = CurrentDb.OpenRecordset("Orders")
        .EndUpdate
    End With
End Sub
Open the C:\Program Files\Exontrol\ExGrid\Sample\SAMPLE.MDB
database
create a new form,
add the control to the form with the name G2antt1
paste the above code
change the \PICTURES with the path where you can
locate the 1.jpg, 2.jpg, ..., 9.jpg
The /COM version of the component provides the DataSource property, which can be
used to bound the control's view to an ADO or DAO recordset. Instead of
Items.CellPicture property you can use the <img> HTML built-in tags to
display one or more custom-size pictures to each cell based on the value. The
method uses the Column.FormatColumn property to specify the format to be
displayed on the column such as <img>P1</img> which means displaying
the picture with the key P1. The HTMLPicture property should be used to assign
the pictures to be used in the control.
The following VB6 sample loads 9 pictures using the HTMLPicture property, and
specify the Column.FormatColumn to display them based on the cell's value:
Private Sub Form_Load()
    With G2antt1
        .BeginUpdate
        For i = 1 To 9
            .HTMLPicture("P" & i) = "\PICTURES\" & i & ".jpg"
        Next
        Set rs = CreateObject("ADOR.Recordset")
        With rs
            .Open "Orders", "Provider=Microsoft.Jet.OLEDB.4.0;Data Source=\SAMPLE.MDB", 3, 3
        End With
        .DataSource = rs
        With .Columns(1)
            .Def(exCellValueFormat) = exHTML
            .FormatColumn = "`<img>P` + value + `</img>`"
        End With
        .EndUpdate
    End With
End Sub
This sample does not use the AddItem event, instead the cell's picture is
automatically updated once the cell's value. Please change the
\SAMPLE.MDB with the path of
your database. For instance: C:\Program Files\Exontrol\ExGrid\Sample\SAMPLE.MDB. Also, please change the \PICTURES with the path where you can
locate the 1.jpg, 2.jpg, ..., 9.jpg
The following VBA/Access sample loads 9 pictures using the HTMLPicture property, and
specify the Column.FormatColumn to display them based on the cell's value:
Private Sub Form_Load()
    With G2antt1
        .BeginUpdate
        Dim i As Long
        For i = 1 To 9
            .HTMLPicture("P" & i) = "\PICTURES\" & i & ".jpg"
        Next
        Set .DataSource = CurrentDb.OpenRecordset("Orders")
        With .Columns(1)
            .Def(exCellValueFormat) = exHTML
            .FormatColumn = "`<img>P` + value + `</img>`"
        End With
        .EndUpdate
    End With
End Sub
Open the C:\Program Files\Exontrol\ExGrid\Sample\SAMPLE.MDB
database
create a new form,
add the control to the form with the name G2antt1
paste the above code
change the \PICTURES with the path where you can
locate the 1.jpg, 2.jpg, ..., 9.jpg
The control provides the Print and Print Preview using the Exontrol's ExPrint
component. The range being shown on the print preview is determined by the bars
in the chart. The bar's caption, notes or any additional objects associates with
a bar or chart can not determine the size of the chart. The control provides the
Chart.StartPrintDate and Chart.EndPrintDate properties that help you to specify
the new range. The Chart.UnitWidth property indicates the width of the base
time-scale unit, so the idea is that you can add a few time-scale units to the
left/right of the range, to enlarge the printing area, and so to let your
additional captions to be included in the Print and Print Preview. Please check
the printing FAQ for
adding Print and Print Preview support in your programming language.
The following VB sample shows how you can add margins to the Print and Print
Preview ( these code must be called before assigning the PrintExt property of
the eXPrint ):
With G2antt1.Chart
    .StartPrintDate = .StartPrintDate - 5
    .EndPrintDate = .EndPrintDate + 5
End With
This sample adds 5 days to left and right of the Print margins. The width in
pixels to be added to the print margins is 5 * Chart.UnitWidth. For instance,
you can use this, if the Chart.UnitScale is exDay.
In case, the Chart.UnitScale is exHour the equivalent code to add 5 hours to
the left and right is:
With G2antt1.Chart
    .StartPrintDate = .StartPrintDate - 5 * 1 / 24
    .EndPrintDate = .EndPrintDate + 5 * 1 / 24
End With
This sample adds 5 hours to left and right of the Print margins. The width in
pixels to be added to the print margins is 5 * Chart.UnitWidth. For instance,
you can use this, if the Chart.UnitScale is exHour.
In case, the Chart.UnitScale is exMinute the equivalent code to add 5 minutes
to the left and right is:
With G2antt1.Chart
    .StartPrintDate = .StartPrintDate - 5 * 1 / 24
    .EndPrintDate = .EndPrintDate + 5 * 1 / 24
End With
This sample adds 5 hours to left and right of the Print margins. The width in
pixels to be added to the print margins is 5 * Chart.UnitWidth. For instance,
you can use this, if the Chart.UnitScale is exHour.
With G2antt1.Chart
    .StartPrintDate = .StartPrintDate - 5 * 1 / 24 / 60
    .EndPrintDate = .EndPrintDate + 5 * 1 / 24 / 60
End With
The control provides the Print and Print Preview using the Exontrol's ExPrint
component. By default, the Print and Print Preview displays all visible columns
of the control. The Visible property of the Column object specifies whether the
column is visible or hidden. In conclusion, all you need is to specify the
columns to be shown on the print and print preview, and restore the Visible
property once the preview is done. For that, all you need is to handle the Refreshing
and Refresh
events of the eXPrint component. Please check
the printing FAQ for
adding Print and Print Preview support in your programming language.
The following VB sample sets the visible columns to be the first column only,
and restore the visibility once the previewing is done:
Create a new form
Add the ExPrint and ExG2antt components to the same form, named Print1 and
G2antt1
Copy/Translate the following code.
Private Sub Print1_Refreshing()
    Dim c As Variant
    With G2antt1
        For Each c In .Columns
            c.Data = c.Visible
            c.Visible = False
        Next
        .Columns(0).Visible = True
    End With
End Sub

Private Sub Print1_Refresh()
    Dim c As Variant
    For Each c In G2antt1.Columns
        c.Visible = c.Data
    Next
End Sub
The sample enumerates all columns and stores the Visible property of the Column to Data property ( you
can hold any value to Data property ), hides the column, and set the Visible
property for the first column to be visible. This way the Print and Print
Preview will display only the columns you need, not all Visible columns. The
Refresh event just restores the Visible properties with saved data. Also, You
can use the Item and Count properties of the Columns to enumerate the Column
objects in the Columns collection.
The control provides the Print and Print Preview using the Exontrol's ExPrint
component. Please check
the printing FAQ for
adding Print and Print Preview support in your programming language.
In order to prevent updating the control during Print and PrintPreview you
need to call the BeginUpdate of the control during the Refreshing
event of the eXPrint, and call the EndUpdate once the Refresh
event of the eXPrint occurs, like in the following sample.
Private Sub Print1_Refreshing()
    G2antt1.BeginUpdate
End Sub

Private Sub Print1_Refresh()
    G2antt1.EndUpdate
End Sub
The Change event of the control notifies your application once the cell's
value is changed. The EditOpen and EditClose events are fired
before and after the user edits a cell, so you can use them to know when user
changes a value in a cell.
The edit events are fired in the following order:
Edit event. Prevents editing cells, before showing the cell's editor.
EditOpen event. The edit operation started, the cell's editor is shown. The Editing property gives the window's handle of the built-in editor being started.
Change event. The Change event is fired if the cell's value is
changed
EditClose event. The cell's editor is hidden and closed.
In conclusion, there are 2 ways of finding when the user changes a value
using the control's UI elements
check the Editing property during the Change event, and if
it returns a non-zero value, the cell's value has been changed using the
control's UI.
use an internal member initialized with zero, increases the member value
when the EditOpen event, and decreases the member value if the
EditClose event occurs.During the Change event you can
check the member if it is zero or not, so you know if there were a change
using the control's UI.
By default, the control's LoadXML/SaveXML methods loads/saves data of the
control, not properties like HeaderVisible. Chart.OverviewVisible and so
on.
Instead, you can extent this behavior by loading/saving your data to the same
XML document like explained bellow:
SaveXML extension
Create a "MSXML.DOMDocument" object
Save the control's data to the newly created IXMLDOMDocument object, using
the control's SaveXML(xml) method
Add additional nodes, attributes to the IXMLDOMDocument object, to save
additional properties of the component
Save the IXMLDOMDocument object to a file or URL, using the IXMLDOMDocument's
save method
LoadXML extension
Create a "MSXML.DOMDocument" object
Load the IXMLDOMDocument object from a file or URL, using the IXMLDOMDocument's
load method
Load the control's data from the IXMLDOMDocument object, using the
control's LoadXML(xml) method
Looks for additional nodes, and load them accordingly
The following VB6 sample defines the SaveXML subroutine, to save the
control's Chart.OverviewVisible property:
Private Sub SaveXML(ByVal g As Object, ByVal f As String)
    Dim xml As Object
    Set xml = CreateObject("MSXML.DOMDocument")

    g.SaveXML xml ' Let the control saves its data to the IXMLDOMDocument object

    With xml.firstChild.appendChild(xml.createNode(1, "Additional", "")).Attributes ' Adds the 'Additional' node, under the 'Content' node
        Dim a As Object
        Set a = xml.createAttribute("Chart_OverviewVisible")
        a.Value = g.Chart.OverviewVisible
        .setNamedItem a ' Create and adds a new attribute 'Chart_OverviewVisible' to 'Additional' node's Attributes to save the value of the Chart.OverviewVisible property
    End With

    xml.save f ' Saves IXMLDOMDocument object to a file/url
End Sub
The following VB6 sample defines the LoadXML subroutine, to load the
control's Chart.OverviewVisible property:
Private Sub LoadXML(ByVal g As Object, ByVal f As String)
    Dim xml As Object
    Set xml = CreateObject("MSXML.DOMDocument")

    xml.Load f  ' Loads IXMLDOMDocument object from a file/url

    With g
        .BeginUpdate
            .LoadXML xml    ' Lets the control loads its data

            Dim c As Object
            For Each c In xml.firstChild.childNodes
                If (c.nodeName = "Additional") Then ' Looks for the "Additional" child node on the 'Content' node
                    With c.Attributes
                        Dim a As Object
                        Set a = .getNamedItem("Chart_OverviewVisible") ' Looks for the 'Chart_OverviewVisible' attribute to be assigned to Chart.OverviewVisible property
                        If Not (a Is Nothing) Then
                            g.Chart.OverviewVisible = a.Value
                        End If
                    End With
                End If
            Next
        .EndUpdate
    End With
End Sub
These samples adds/loads an "Additional" node under the
"Content" node ( base element ), and save/load the control's property
to an attribute. The sample can be extended to save/load any additional
property.
Having these, instead calling directly the control's SaveXML method, you need
to call the SaveXML control, file/url, and to load the control's data
using the XML, you need to call LoadXML control, file/url
The cause that generates this behavior is the control's Anchor/Dock property. The Anchor/Dock property gets or sets the edges of the container to which a control is bound and determines how a control is resized with its parent.
What is happen is that when the form is minimized, the control's size goes to (0,0), and
so when the form is restored, the chart panel is resized to fulfill the control's client area (this behavior may happen when the control's OnResizeControl is exResizeChart)
In order to prevent this behavior you can:
(Solution 1) Override the OnResize event (prevents handling the base's
OnResize once the form gets minimized)
Protected Overrides Sub OnResize(ByVal e As System.EventArgs)
  If (WindowState <> FormWindowState.Minimized) Then
      MyBase.OnResize(e)
  End If
End Sub
the code disables executing the anchoring/docking, while the form is minimized.
(Solution 2) Override the WndProc procedure, saves the width of the
chart's left-panel when the form gets minimized, and restores it once the
form gets restores)
C#
protected int paneWidthLeft = 0;
protected override void WndProc(ref System.Windows.Forms.Message m)
{
    if ((m.Msg == 0x112) && ((int)m.WParam == 0xF020)) // 0x112 stands for WM_SYSCOMMAND and 0xF020 for SC_MINIMIZE
        paneWidthLeft = exg2antt1.Chart.PaneWidthLeft; // saves the width of the left-panel (when the form gets minimized)

    base.WndProc(ref m);

    if ((m.Msg == 0x112) && ((int)m.WParam == 0xF120)) // 0x112 stands for WM_SYSCOMMAND and 0xF120 for SC_RESTORE
        exg2antt1.Chart.PaneWidthLeft = paneWidthLeft; // restores the width of the left-panel (when the form gets restored)
}
VB.NET
Protected paneWidthLeft As Integer = 0
Protected Overrides Sub WndProc(ByRef m As System.Windows.Forms.Message)
    If (m.Msg = &H112 And m.WParam = &HF020) Then ' &H112 stands for WM_SYSCOMMAND and &HF020 for SC_MINIMIZE
        paneWidthLeft = Exg2antt1.Chart.PaneWidthLeft ' saves the width of the left-panel (when the form gets minimized)
    End If

    MyBase.WndProc(m)

    If (m.Msg = &H112 And m.WParam = &HF120) Then ' &H112 stands for WM_SYSCOMMAND and &HF120 for SC_RESTORE
        Exg2antt1.Chart.PaneWidthLeft = paneWidthLeft ' restores the width of the left-panel (when the form gets restored)
    End If
End Sub
the code saves the width of the chart's left-panel when the form gets minimized, and restores it once the form gets restores.
The idea is using the Add method of the Controls property like shown in the
following VB.NET sample:
Dim b As New Button
With b
    b.Text = "Command"
    .Anchor = AnchorStyles.Right
    .Left = Exg2antt1.Width - .Width
    With Exg2antt1
        b.Top = b.Top + .HeaderHeight * .Chart.LevelCount
    End With
End With
Exg2antt1.Controls.Add(b)
The sample adds a command button inside the control, and aligns it to the
right just bellow to the control's header. In order to add events to the
inserted command button, you need to use the AddHandler method to add
dynamically a handler to desired event like in the following sample:
Dim b As New Button
With b
    b.Text = "Command"
    .Anchor = AnchorStyles.Right
    .Left = Exg2antt1.Width - .Width
    With Exg2antt1
        b.Top = b.Top + .HeaderHeight * .Chart.LevelCount
    End With
End With
Exg2antt1.Controls.Add(b)
AddHandler b.Click, AddressOf BCLickEvent
where the BClickEvent shows as follows:
Sub BCLickEvent(ByVal sender As Object, ByVal e As System.EventArgs)
    MsgBox("Click")
End Sub
The Chart.AllowCreateBar property of the control specifies whether the user can
create bars at runtime, by dragging them on the chart panel of the control. The
idea is to handle the MouseDown event, get the item from the point, collect the
number of bars inside the item, and if it is not 0, set the Chart.AllowCreateBar
property on exNoCreateBar(0) as in the following VB sample:
Private Sub G2antt1_MouseDown(Button As Integer, Shift As Integer, X As Single, Y As Single)
    Dim i, c As Long, hit As HitTestInfoEnum
    With G2antt1
        Dim nAllowCreateBar As CreateBarEnum
        nAllowCreateBar = exCreateBarAuto
            i = .ItemFromPoint(-1, -1, c, hit)
            If (i <> 0) Then
                If Not (0 = .Items.ItemBar(i, "<*>", exBarsCount)) Then
                    nAllowCreateBar = exNoCreateBar
                End If
            End If
        .Chart.AllowCreateBar = nAllowCreateBar
    End With
End Sub
The sample just change the Chart.AllowCreateBar property based on the number
of bars of the item from the cursor.
The ItemFromPoint(-1,-1) property gets the handle if the item, index of the
column and the hit-test position from the cursor position. Usually, the you
think that the ItemFromPoint(-1,-1) is not working in debug mode, because you
have set the breakpoint on the property itself, and you are moving the cursor
position by the time the ItemFromPoint property is called. What you can do, is
to set the break-point after calling the ItemFromPoint property is called, so
the correct position of the cursor is taken when the property is invoked. In
other words, please add the following code, and see that the handle of the item
being clicked is displayed correctly, like in the following VB sample:
Private Sub G2antt1_Click()
    Dim c As Long, hit As EXG2ANTTLibCtl.HitTestInfoEnum
    Debug.Print G2antt1.ItemFromPoint(-1, -1, c, hit)
End Sub
The BeforeExpandItem event is fired when an item is about to be expanded, by code or using the control's user interface ( such as
clicking the +/- expanding button ). Also, the BeforeExpandItem event may occur
for items with the ItemHasChildren property set on True, when the user clicks
the filter drop down button. This is by design, to include not-loaded items in
the drop down filter window. Usually, the BeforeExpandItem event is used to load
virtually a hierarchy, for instance, when the user clicks the +/- expanding
button.
The following methods, can be used to prevent firing the BeforeExpandItem event when
the user clicks the drop down filter button:
Use no ItemHasChildren property on True, in other words you
can load on init time, the entire hierarchy collection
Set the FilterList property of the Column object to exRootItems value (4), so no child items are collected in the drop down filter
list
Use a counter that's increased when MouseDown event occurs
and it is decreased when MouseUp event is fired. You can use the ColumnFromPoint property to check if the user clicks the headers.
During the BeforeExpandItem event you can prevent adding a sub-child if the
counter is not zero.
The control's ClearFilter method ( or clicking the X button in the filter bar )
does the following:
set the Column.Filter property on empty, IF the Column.FilterType property
is exNumeric, exCheck or exImage, else
set the Column.FilterType property on exAll. IF the Column.FilterOnType
property is True, the Column.Filter is set on empty too, else the
Column.Filter property remains.
The FilterType property of the Column object indicates the type of the filter
to be applied on the column. Generally, you can check for exAll on FiterType
unless you are not using the exNumeric, exCheck or exImage type of column's
filters.
The following VB function returns False, if no filter is applied, or True,
if any filter is applied. This sample works ok, if no using any of exNumeric,
exCheck or exImage types
Private Function hasFilter(ByVal g As Object) As Boolean
    Dim c As Object
    For Each c In g.Columns
        If Not (c.FilterType = 0) Then
            hasFilter = True
            Exit Function
        End If
    Next
    hasFilter = False
End Function
The following VB function returns False, if no filter is applied, or True,
if any filter is applied. This sample works for all type of filters:
Private Function hasFilter(ByVal g As Object) As Boolean
    Dim c As Object
    For Each c In g.Columns
        Select Case c.FilterType
            Case 5, 6, 10                           ' exNumeric, exCheck, exImage>
                hasFilter = Not (c.Filter.Length = 0)
            Case Else
                hasFilter = Not (c.FilterType = 0)  ' exAll
        End Select
        If (hasFilter) Then
            Exit Function
        End If
    Next
    hasFilter = False
End Function
The control's SaveXML method saves the control's content to an XML format.
The SaveXML's Destination parameter could be one of the following:
String - Specifies the file name. Note that this must be a file name,
rather than a URL. The file is created if necessary and the contents are
entirely replaced with the contents of the saved document. For example:
G2antt1.SaveXML("sample.xml")
Reference to a String member - Saves the control's content to the string
member. Note that the string member must be empty, before calling the
SaveXML method. For example:
Dim s As String
G2antt1.SaveXML s
In VB.NET for /NET assembly, you should call such as :
Dim s As String = String.Empty
Exg2antt1.SaveXML(s)
In C# for /NET assembly, you should call such as :
string s = string.Empty;
exg2antt1.SaveXML(ref s);
XML Document Object. For example:
Dim xmldoc as Object
Set xmldoc = CreateObject("MSXML.DOMDocument")
G2antt1.SaveXML(xmldoc)
Custom object supporting persistence - Any other custom
COM object that supports QueryInterface for IStream, IPersistStream,
or IPersistStreamInit can also be provided here and the document will
be saved accordingly. In the IStream case, the IStream::Write
method will be called as it saves the document; in the IPersistStream
case, IPersistStream::Load will be called with an IStream that
supports the Read, Seek, and Stat methods.
In conclusion, you can pass the reference to a string member to SaveXML, and
so you get the control's data as a text using one of the following:
Dim s As String
G2antt1.SaveXML s
In VB.NET for /NET assembly, you should call such as :
Dim s As String = String.Empty
Exg2antt1.SaveXML(s)
In C# for /NET assembly, you should call such as :
string s = string.Empty;
exg2antt1.SaveXML(ref s);
The LoadXML method loads the control's data from your source, in this case
the generated string.
The Items.ItemByIndex(index) property gets the handle of the item/row giving its
index.
If you can not locate the ItemByIndex property in the Items collection you
should look for Items.get_ItemByIndex(index), Items[index]
or Items(index) instead.
The tooltip is automatically hidden when the user moves the mouse or a key is
pressed. In case a message box or a form is shown, none of them is happen, so
the tooltip may still be shown. For that, you can call the PostMessage .hwnd,
512, 0, 0 before showing your message or dialog like in the following sample.
The hWnd indicates the handle of the control ( hWnd property ).
Private Sub G2antt1_MouseUp(Button As Integer, Shift As Integer, X As Single, Y As Single)
    If (Button = 2) Then
        With G2antt1
            Dim i As Long, c As Long, hit As HitTestInfoEnum
            i = .ItemFromPoint(-1, -1, c, hit)
            If Not i = 0 Then
                PostMessage .hwnd, &H200, 0, 0
                MsgBox .Items.CellCaption(i, c)
            End If
        End With
    End If
End Sub
The PostMessage API places (posts) a message in the message queue associated with the thread that created the specified window and returns without waiting for the thread to process the message.
You can use also the SendMessage API, which sends the specified message to a window or windows. The
SendMessage function calls the window procedure for the specified window and does not return until the window procedure has processed the message.
The control provides three type of scroll bars: two ( horizontal/vertical ) for
list part of the control, and one ( horizontal ) for the chart section of the
control. The ScrollPos property and OffsetChanged event handle changes for the
two ( horizontal/vertical ) scroll bars of the list part of the control. The
Chart.FirstVisibleDate property and DateChange event handles changes for the one
( horizontal ) scroll bar of the chart section of the control.
In order to synchronize the date in the chart portion of the control (
horizontal ), you need to handle the DateChange event like in the following
sample:
Private Sub G2antt1_DateChange()
    With G2antt2
        .Chart.FirstVisibleDate = G2antt1.Chart.FirstVisibleDate
        .Object.Refresh
    End With
End Sub

Private Sub G2antt2_DateChange()
    With G2antt1
        .Chart.FirstVisibleDate = G2antt2.Chart.FirstVisibleDate
        .Object.Refresh
    End With
End Sub
The Refresh method should be called, to perform all the required changes, and
also make sure that the control's Refresh method is called, not the wrappers'
Refresh method ( /COM version only ). That's why we invoked the .Object.Refresh
method rather than .Refresh. In case you are unsure of this, you can call the
control's Template = "Refresh()", which will do the same, will invoke
the control's Refresh method. This snippet of code changes the control's FirstVisibleDate property when the
other's control is invoking the DateChange event. The first visible date in the
chart can be changed in several way, not only by dragging or clicking the scroll
bar's thumb. For instance, you can click the chart's header and drag the date to
a new position to the left or to the right, you can move a bar by dragging left
or right to chart's client area, and so on.
Prior to version 16.0 the recursive call may not be prevented, so you need to
use the following snippet of code. In order to synchronize the date in the chart portion of the control (
horizontal ), you need to handle the DateChange event like in the following
sample:
Private Sub G2antt1_DateChange()
    If (iSyncing = 0) Then
        iSyncing = iSyncing + 1
            With G2antt2
                .BeginUpdate
                .Chart.FirstVisibleDate = G2antt1.Chart.FirstVisibleDate
                .EndUpdate
            End With
        iSyncing = iSyncing - 1
    End If
End Sub

Private Sub G2antt2_DateChange()
    If (iSyncing = 0) Then
        iSyncing = iSyncing + 1
            With G2antt1
                .BeginUpdate
                .Chart.FirstVisibleDate = G2antt2.Chart.FirstVisibleDate
                .EndUpdate
            End With
        iSyncing = iSyncing - 1
    End If
End Sub
This snippet of code changes the control's FirstVisibleDate property when the
other's control is invoking the DateChange event.
If you need to update the width of the panels when a change occurs in any of
them you can handle the ChartEndChanging event like in the following sample:
Private Sub G2antt1_ChartEndChanging(ByVal Operation As EXG2ANTTLibCtl.BarOperationEnum)
    If (Operation = exVSplitterChange) Then
        G2antt2.Chart.PaneWidth(False) = G2antt1.Chart.PaneWidth(False)
    End If
End Sub

Private Sub G2antt2_ChartEndChanging(ByVal Operation As EXG2ANTTLibCtl.BarOperationEnum)
    If (Operation = exVSplitterChange) Then
        G2antt1.Chart.PaneWidth(False) = G2antt2.Chart.PaneWidth(False)
    End If
End Sub
The control's ScrollPos property changes the control list's scroll position ( horizontal or/and
vertical scroll position ). The OffsetChanged event occurs when the control's
scroll horizontal or vertical position is changed, in other words all it is
required is calling the ScrollPos during the OffsetChanged like in the following
sample. Because the ScrollPos property invokes the OffsetChanged, you must use a
member flag ( iSyncing ) to prevent recursive calls:
Private iSyncing As Long

Private Sub G2antt1_OffsetChanged(ByVal Horizontal As Boolean, ByVal NewVal As Long)
    If (iSyncing = 0) Then
        iSyncing = iSyncing + 1
            G2antt2.ScrollPos(Not Horizontal) = NewVal
        iSyncing = iSyncing - 1
    End If
End Sub

Private Sub G2antt2_OffsetChanged(ByVal Horizontal As Boolean, ByVal NewVal As Long)
    If (iSyncing = 0) Then
        iSyncing = iSyncing + 1
            G2antt1.ScrollPos(Not Horizontal) = NewVal
        iSyncing = iSyncing - 1
    End If
End Sub
This sample synchronizes the vertical / horizontal scroll bars of both
controls, so when the user scrolls one of the control's content, the other
component is syncing as well.
The KeyPress event notifies your application once the user presses the SPACE
key, or any other character. In other words, you can disable handing the space
key by setting the KeyAscii parameter on 0 as in the following sample:
Private Sub G2antt1_KeyPress(KeyAscii As Integer)
    With G2antt1
        If (.Editing = 0) Then
            If (KeyAscii = vbKeySpace) Then ' vbKeySpace is 32
                KeyAscii = 0
            End If
        End If
    End With
End Sub
The Items.DefineSummaryBars method defines one or more bars to be child of
specified summary bar. The following sample shows how you can add summary bars
while user groups/sort by a column:
Private Sub G2antt1_AddGroupItem(ByVal Item As Long)
    With G2antt1.Items
        .AddBar Item, "Summary", Nothing, Nothing, "summary"
        .DefineSummaryBars Item, "summary", -1, ""
    End With
End Sub
A. First you need to define the percent bar by adding the "Task%Progress"
like in the following sample:
With G2antt1.Chart.Bars.Add("Task%Progress")
    .Shortcut = "Task"
End With
This code defines the new "Task" bar to support and display the
exBarPercent value. This code should be called before adding any column/item/bar
to the control.
B. Now, let's associate the "Start" and
"End" to exBarStart, exBarEnd, and "% Completed" to exBarPercent value
of the bar
with G2antt1
    .Columns("Start").Def(exCellValueToItemBarProperty) = exBarStart
    .Columns("End").Def(exCellValueToItemBarProperty) = exBarEnd
    .Columns("% Completed").Def(exCellValueToItemBarProperty) = exBarPercent
end with
C. Now, here's the code to add the bar during the AddItem event, which
we will use to initialize the exBarPercent to be displayed on the bar:
Private Sub G2antt1_AddItem(ByVal Item As Long)
    With G2antt1.Items
        .AddBar Item, "Task", .CellValue(Item, "Start"), .CellValue(Item, "End")
        .ItemBar(Item, "", exBarPercent) = .CellValue(Item, "% Completed")
    End With
End Sub
The "Start" and "End" are the name of the columns that
hold the start and end margins of the tasks. The "% Completed" is the name of
the column that holds the % percent values to display on bars ( numeric from 0
to 1). Calling the .ItemBar(Item, "", exBarPercent) = .CellValue(Item, "% Completed")
during the AddItem is required to initialize the exBarPercent of the task
at adding time. After that any change to exBarPercent will be reflected in the "%
Completed" column, due .Columns("% Completed").Def(exCellValueToItemBarProperty) = exBarPercent
call.
The Template call opens the eXPrint's Print and Print-Preview framework to
display the control. The Template property of the control executes x-script
code.
The Items.AllowCellValueToItemBar property
allows you to associate a cell with a bar's property such as StartDate, EndDate,
Duration, and so on. When user changes the start date in the Start column,
the associated bar's changes its starting point, the same as would the user will
resize the starting point of the bar by dragging, so resizing the bar is
performed.
In order to keep the bar's length or duration when the user edits the Start
column, you need to handle the Change event, to update the ItemBar(exBarEnd)
property too, as in the following sample:
Private Sub G2antt1_Change(ByVal Item As EXG2ANTTLibCtl.HITEM, ByVal ColIndex As Long, NewValue As Variant)
    With G2antt1.Items
        If (ColIndex = 1) Then ' The index of the Start column is 1
            .ItemBar(Item, "", exBarEnd) = NewValue + .ItemBar(Item, "", exBarDuration)
        Else
            If (ColIndex = 2) Then ' The index of the End column is 2
                .ItemBar(Item, "", exBarStart) = NewValue - .ItemBar(Item, "", exBarDuration)
            End If
        End If
    End With
End Sub
The samples changes the ending point of the bar ( exBarStart ) when a change
occurs in the Start column, and the starting point of the bar ( exBatStart ),
when a change occurs in the End column.
The idea of adding recurring tasks to eXG2antt consists in:
Handle the DateChanged event of the eXG2antt component
Collects the occurrences of the recurrence expression between first
visible date and last visible date, using the RecurRange method of the eXICalendar library
For each occurrence found, add a new task using the AddBar method of
the Items collection of eXG2antt component
The following VB sample adds recurring tasks to eXG2antt :
Function Max(ByVal a As Double, ByVal b As Double) As Double
    Max = IIf(a < b, b, a)
End Function

Private Sub Form_Load()
    With G2antt1
        .BeginUpdate
        .Columns.Add "Tasks"
        .Items.AddItem "Every Friday, starting from 2015, Dec 1st"
        With .Chart
            .LevelCount = 2
            .PaneWidth(0) = 224
            .Bars("Task").Pattern = exPatternSolid
            .FirstVisibleDate = #11/23/2015#
        End With
        .EndUpdate
    End With
End Sub

Private Sub G2antt1_DateChange()
    With G2antt1
        .BeginUpdate
        Dim o As Variant
        For Each o In CreateObject("Exontrol.ICalendar").RecurRange("DTSTART=20151201;FREQ=WEEKLY;BYDAY=FR", .Chart.FirstVisibleDate, Max(.Chart.FirstVisibleDate + (1 + .Chart.PaneWidth(False) + .Chart.PaneWidth(True)) / .Chart.UnitWidth, .Chart.DateFromPoint(1, -1)))
            .Items.AddBar .Items.FirstVisibleItem, "Task", o, o + 1, o
        Next
        .EndUpdate
    End With
End Sub
and you should get:
A few notes:
The DateFromPoint(1, -1) property determines the last visible date.
The Max(.Chart.FirstVisibleDate
+ (1 + .Chart.PaneWidth(False) + .Chart.PaneWidth(True)) / .Chart.UnitWidth,
.Chart.DateFromPoint(1, -1))), determines the maximum between
the last visible date if no columns section is displayed and the
currently last visible date
The initial FirstVisibleDate
should be called after filling the columns/items, so during the DateChange
event, the FirstVisibleItem property is
NOT zero, so adding bars is possible
By default, the control's SchedulePDM
method arrange the activities on the plan based on the links / relationships / dependencies. The SchedulePDM calculates early and late dates, based on bar's position, link types and link lag. The SchedulePDM starts from the giving bar, and continue arranging related bars, till done. If a bar has no related bars ( no incoming or outgoing links ) the procedure still looking for grouped or summary bars, till found some relative bars. The SchedulePDM method keeps count on the grouping bars, limited bars ( the bars that have margins, or range ), summary bars, non-working units, and
so on.
The following sample, shows how you can change the SchedulePDM
behavior, to include the distance between linked bars. For instance, if
two bars are linked with a FS link, and the user moves the ending bar to
the right, the SchedulePDM automatically drags the starting bar closer to
the ending bar, instead letting the distance untouched. In order to
prevent, that, you need to call the RuntimeLag before calling the
SchedulePDM method.
The RuntimeLag procedure enumerates all links of the control, and for
each link changes the Link(exLinkPDMDelay) property to be the positive
distance between linked bars, as shown in the following sample:
Private Sub RuntimeLag()
With G2antt1.Items
Dim k As Variant
k = .FirstLink()
While Not IsEmpty(k)
Dim dbLag As Double
dbLag = .ItemBar(.Link(k, exLinkEndItem), .Link(k, exLinkEndBar), exBarStart) - .ItemBar(.Link(k, exLinkStartItem), .Link(k, exLinkStartBar), exBarEnd)
.Link(k, exLinkPDMDelay) = IIf(dbLag < 0, 0, dbLag)
k = .NextLink(k)
Wend
End With
End Sub
In order to keep the distance between activities when performing the
SchedulePDM call, you must call the RuntimeLag procedure before
SchedulePDM method. The RuntimeLag procedure, calculates the distance
between start date-time of ending bar and end date-time of the starting
bar ( exFS type ). The RuntimeLag procedure should be adapted, if you are
using exSS or exFF type of links. For instance, for a exSS link, you
should calculate the distance between start date-time of ending bar and
start date-time of the starting bar, and for exFF type you should
calculate the distance between end date-time of ending bar and end
date-time of the starting bar.
The following screen shot shows the activities before calling the
SchedulePDM method:
The following screen shot shows the activities after calling the SchedulePDM method:
The following screen shot shows the activities after calling the RuntimeLag + SchedulePDM method:
The AllowAutoDrag event triggers contiguously while the user drags / hovers the focus/selection of items over the control. The GetAsyncKeyState API method can be used to detect whether the mouse button has been released, and so the drop action occurs.
The following VB sample displays "Drag" while user dragging the items, and displays "Drop", when drop operation starts.
Private Sub G2antt1_AllowAutoDrag(ByVal Item As EXG2ANTTLibCtl.HITEM, ByVal NewParent As EXG2ANTTLibCtl.HITEM, ByVal InsertA As EXG2ANTTLibCtl.HITEM, ByVal InsertB As EXG2ANTTLibCtl.HITEM, Cancel As Boolean)
With G2antt1
Debug.Print "Drag"
If (GetAsyncKeyState(VK_LBUTTON) = 0) Then
Debug.Print "Drop"
End If
End With
End Sub
where declarations for GetAsyncKeyState API used is:
Private Const VK_LBUTTON = &H1
Private Declare Function GetAsyncKeyState Lib "user32" (ByVal vKey As Long) As Integer
Once you run the code, you will notice that the AllowAutoDrag event "Drop" may be fired multiple times, so we suggest to postpone any of your actions ( like displaying a message box ), by posting a window message or use a timer event, to let the control handles / completes the event as in the following sample:
Private Sub G2antt1_AllowAutoDrag(ByVal Item As EXG2ANTTLibCtl.HITEM, ByVal NewParent As EXG2ANTTLibCtl.HITEM, ByVal InsertA As EXG2ANTTLibCtl.HITEM, ByVal InsertB As EXG2ANTTLibCtl.HITEM, Cancel As Boolean)
With G2antt1
Debug.Print "Drag"
If (GetAsyncKeyState(VK_LBUTTON) = 0) Then
mctlTimerDrop.Enabled = True
End If
End With
End Sub
where mctlTimerDrop is defined as follows:
Dim WithEvents mctlTimerDrop As VB.Timer
Private Sub mctlTimerDrop_Timer()
mctlTimerDrop.Enabled = False
MsgBox "Drop."
End Sub
Private Sub Form_Load()
Set mctlTimerDrop = Me.Controls.Add("VB.Timer", "DropTimer1")
With mctlTimerDrop
.Enabled = False
.Interval = 100
End With
End Sub
The eXG2antt component (Target) can display resources being used by
another eXG2antt component ( Source ). The resources in the Source control
must be specified by the ItemBar(exBarResources)
property such as "R1,R2" indicates that the bar/activity is
using R1 and R2 resources. The PutRes
method can displays Resources from the Source to Target, or can update the
Resources from Target to the Source control.
In order to use the PutRes method the Source control must:
specify the activity/bar's resources using the
ItemBar(exBarResources) property
Now, let's display the Resources of the Source into the Target
control ( Target.PutRes Source.ResHandle, exPutResLoad )
First step is specifying the ItemBar(exBarResources) property in the
Source control. If the Source control has no bars with the
ItemBar(exBarResources) property, no resource will be displayed in the
target control.
The following sample adds a column and two activities/bars, with
allocated resources:
With Source
.BeginUpdate
With .Chart
.FirstVisibleDate = #1/1/2001#
With .Bars("Task")
.Def(exBarHAlignCaption) = 18
.Def(exBarCaption) = "<%=%49%>"
End With
End With
.Columns.Add "Tasks"
Dim h As Long
With .Items
h = .AddItem("Task 1")
.AddBar h, "Task", #1/6/2001#, #1/12/2001#, "K1"
.ItemBar(h, "K1", exBarResources) = "R1,R2"
h = .AddItem("Task 2")
.AddBar h, "Task", #1/4/2001#, #1/14/2001#, "K2"
.ItemBar(h, "K2", exBarResources) = "R2[75%],R3"
End With
.EndUpdate
End With
and the Source should show as:
The second step is calling the PutRes method as follows:
Target.PutRes Source.ResHandle, exPutResLoad
and the Target should show as:
The PutRes(exPutResLoad) method updates the Target as follows:
adds the "Resources" column ( nothing
happens if the PutRes method was already called, or the Target control
already contains a column with the Key "Resources" )
adds a new item with the name of the resource for each
resource found ( ItemBar(exBarResources) ) in the Source control ( R1, R2, ...
)
adds a new bar for each activity/bar in the Source
control, that uses the specified resource, where the
ItemBar(exBarPercent) and ItemBar(exBarEffort) properties indicate the usage of the
resource ( double expression between 0 and 1 ).
The ItemBar(exBarEffort) property should be updated with the
ItemBar(exBarPercent), during the BarResizing event, in case you
provide a histogram view for the Target control, as explained bellow.
As the Target control can display multiple
activities/bars on the same row/item/resource we should make a few adjustments
on the Target control as:
With Target
With .Chart
.FirstVisibleDate = Source.Chart.FirstVisibleDate
With .Bars.Add("Task%Progress")
.OverlaidType = exOverlaidBarsStack Or exOverlaidBarsStackAutoArrange
.Shortcut = "Task"
End With
End With
End With
The code, defines the "Task" bar to display
"Progress", and to be stacked on the same row. This code, should
be called once, before calling the PutRes and so the Target should show
as:
Now, let's display the histogram of Resources usage in
the Target control
The Target control represents a task into it's histogram
only if:
ItemBar(exBarEffort)
property specifies the effort to execute an unit in the task. By
default, the ItemBar(exBarEffort) property is initialize with the
ItemBar(exBarPercent) ( resource usage percent )
The first step is to change the Target's code initialization as follows:
With Target
With .Chart
.FirstVisibleDate = Source.Chart.FirstVisibleDate
With .Bars.Add("Task%Progress")
.OverlaidType = exOverlaidBarsStack Or exOverlaidBarsStackAutoArrange
.Shortcut = "Task"
.HistogramPattern = exPatternShadow
.HistogramCriticalColor = .HistogramColor
.ShowHistogramValues = "1"
End With
.HistogramVisible = True
.HistogramView = exHistogramCheckedItems
.HistogramHeight = 164
End With
With .Columns.Add("Names")
.Key = "Resources"
.Def(exCellHasCheckBox) = True
End With
End With
The code does the following:
adds a column "Names", with the Key
"Resources", that displays a check-box for each item, so
next PutRes call won't add a new column
change the bar's HistogramPattern so the "Task" will be
displayed in the control's histogram
display the control's histogram view
The second step is updating the exBarEffort with
exBarPercent value, when the BarResizing event occurs:
Private Sub Target_BarResizing(ByVal Item As EXG2ANTTLibCtl.HITEM, ByVal Key As Variant)
With Target.Items
.ItemBar(Item, Key, exBarEffort) = .ItemBar(Item, Key, exBarPercent)
End With
End Sub
The third step is calling the PutRes method as follows:
Target.PutRes Source.ResHandle, exPutResLoad
and the Target should show as:
Now, let's make the histogram displays
cumulative-percents instead:
So, the first step is to change the Target's code initialization as
follows:
With Target
With .Chart
.FirstVisibleDate = Source.Chart.FirstVisibleDate
With .Bars.Add("Task%Progress")
.OverlaidType = exOverlaidBarsStack Or exOverlaidBarsStackAutoArrange
.Shortcut = "Task"
.HistogramType = exHistOverAllocation Or exHistCumulative
.HistogramCumulativeColor(1) = RGB(255, 255, 0)
.HistogramColor = RGB(196, 196, 196)
.HistogramPattern = exPatternShadow
.ShowHistogramValues = "value > 100 ? 255 : 1"
End With
.HistogramVisible = True
.HistogramView = exHistogramCheckedItems
.HistogramHeight = 96
End With
With .Columns.Add("Names")
.Key = "Resources"
.Def(exCellHasCheckBox) = True
End With
End With
The code does the following:
adds a column "Names", with the Key
"Resources", that displays a check-box for each item, so
next PutRes call won't add a new column
change the bar's HistogramPattern so the "Task" will be
displayed in the control's histogram
display the control's histogram view
The second step is calling the PutRes method as follows:
Target.PutRes Source.ResHandle, exPutResLoad
The third step is updating the exBarEffort after PutRes
call as follows:
With Target.Items
Dim Item As Variant
For Each Item In Target.Items
Dim Key As Variant
Key = .FirstItemBar(Item)
While Not IsEmpty(Key)
.ItemBar(Item, Key, exBarEffort) = .ItemBar(Item, Key, exBarPercent) * .ItemBar(Item, Key, exBarDuration)
Key = .NextItemBar(Item, Key)
Wend
Next
End With
The code enumerates all the bars in the Target control,
and changes the exBarEffort property to be exBarPecent of exBarDuration.
This code is required as for exHistOverAllocation type the work-load for a task is computed as ItemBar(exBarEffort) /
ItemBar(exBarDuration). The work-load for the task is the work effort / task duration. (i.e. If item.exBarEffort = 1 and
the bar's length is 10 days, then the work-load = 0.1 or 10%).
We also, should apply the change of exBarEffort when the
BarResizing event, such as:
Private Sub Target_BarResizing(ByVal Item As EXG2ANTTLibCtl.HITEM, ByVal Key As Variant)
With Target.Items
.ItemBar(Item, Key, exBarEffort) = .ItemBar(Item, Key, exBarPercent) * .ItemBar(Item, Key, exBarDuration)
End With
End Sub
and the Target should show as:
Now, let's update the Source control from the Target
control (Source.PutRes Target.ResHandle, exPutResSave):
The following code should be called to synchronize the
Start/End/Resource-Usage from the Target to the Source
Source.PutRes Target.ResHandle, exPutResSave
The PutRes(exPutResSave) method updates the Source control
as follows:
updates the activity/bar's Start / ItemBar(exBarStart)
and End / ItemBar(exBarEnd) date-time, in
the Source control, according to its associated bar in the Target
control
updates the ItemBar(exBarResources) property in the
Source control, with the new resource usage being indicated by
ItemBar(exBarPercent) property in the Target control.
Now, let's change the caption of bars(resources) in the Target control:
By default, each bar(resource) in the Target control takes the caption being
displayed on the column with the index 0 ( the first column added ) of the
Source control. In order to change automatically the bar's caption you have to
change the captions being shown in the column with the index 0, in the Source
control. For instance we are going to use the FormatColumn property of the
Column object, but the same idea can be applied to any other method like
ComputedField, and so on. The idea, is to change the column using the
FormatColumn method, call the PutRes method, and restores the column's
FormatColumn method, like in the following sample:
Dim sFormatColumn As String, oColumn As Column
Set oColumn = Source.Columns(0)
sFormatColumn = oColumn.FormatColumn
oColumn.FormatColumn = "upper(value) replace ` ` with `<b><off 4>`"
Target.PutRes Source.ResHandle, exPutResLoad
oColumn.FormatColumn = sFormatColumn
and the result will be:
Please pay attention, that the FormatColumn is called BEFORE the PutRes method, else the method will have no effect.
The FormatColumn method specifies the format to display the cells in the column. You can use or display values/captions from other columns as well as explained here.
For instance, "%C0 + ` ` + %C1" displays the captions from the column with the
index 0 and 1 separated by a space character, so you can easily combine or display anything from the Source control to be shown on the bar(resource) of the Target control.
You can change the bars in the Target control, use the ItemBar / ItemBarEx property of the Items collection, as explained:
The ItemBar property gets or sets a property of a bar. The ItemBarEx property is an extension of ItemBar property, that allows changing the properties for a set of bars, using expressions.
For instance, you want to select all bars whose value on the Country column is France, or move all bars of type "Task", change the color for all checked items, change the percent for
selected bars, and so on. The following sample removes all captions of all bars in the Target control
Target.PutRes Source.ResHandle, exPutResLoad
With Target.Items
.ItemBar(0, "<*>", exBarCaption) = ""
End With
In the same maner, you can change the colors for all bars as:
Target.PutRes Source.ResHandle, exPutResLoad
With Target.Items
.ItemBar(0, "<*>", exBarColor) = vbRed
End With
and so the result will be:
Please pay attention, that the ItemBar is called AFTER the PutRes method, else the method will have no effect.
By default, clicking a bar may start one or more operations like follows:
selecting, unselecting one or more bar
moving the bars to a new position
resizing the bars
moving the bars to a new parent item
linking the current bar with another bar
scrolling the chart section ( AutoDrag property )
starts an OLE Drag and Drop operation ( OLEDropMode property )
and so on.
Because of these, selecting the bar is done once the user releases the
mouse button.
In order to change this behavior, you must change the AllowSelectObjects
property of the Chart to exNoSelectObjects(0), and to handle the MouseDown
event like follows:
Private Sub G2antt1_MouseDown(Button As Integer, Shift As Integer, X As Single, Y As Single)
With G2antt1
Dim b As Variant
b = .Chart.BarFromPoint(-1, -1)
If IsEmpty(b) Then
.Items.ItemBar(0, "<*>", exBarSelected) = False ' Unselects all
Else
Dim h As HITEM, c As Long, hit As EXG2ANTTLibCtl.HitTestInfoEnum
h = .ItemFromPoint(-1, -1, c, hit)
If Not (h = 0) Then
With .Items
If (Shift = 0) Then
If Not (.ItemBar(h, b, exBarSelected)) Then
.ItemBar(0, "<*>", exBarSelected) = False ' Unselects all
End If
End If
.ItemBar(h, b, exBarSelected) = IIf(Shift = 0, True, Not .ItemBar(h, b, exBarSelected)) ' Selects the bar if no CTRL key, or toggle its selection state if CTRL is pressed
End With
End If
End If
End With
End Sub
The sample gets the bar from the current cursor position, if any, unselect
all bars if no CTRL is pressed, else it selects / unselects the bar from
the cursor based on the CTRL key state.
The control supports undo-redo, for almost all UI operations of the bars
and links on the chart view of the control. The Chart.AllowUndoRedo
property specifies whether the control supports undo-redo for objects on
the chart section of the control. By default, the Chart.AllowUndoRedo
property is False, which indicates that no support for undo-redo. Once the
Chart.AllowUndoRedo property is True, the control records the actions performed,
so once the user presses the CTRL + Z ( Undo ) the control undo the last
chart operation, and if the CTRL + Y ( Redo ) is pressed redoes the next
action in the chart's Redo queue.
In order to synchronize the bars /
links with a database, you may need to
know the actions that the chart performs when the user does Undo / Redo
operations. In order to to that you need to use any of the following:
UndoListAction property returns the list of actions, the Undo
performs
RedoListAction property returns the list of actions, the Redo
performs
ChartStartChanging(exUndo) event notifies your application that the
Undo operation is about to start (CTRL + Z)
ChartEndChanging(exUndo) event notifies your application that the
Undo operation has been completed (CTRL + Z)
ChartStartChanging(exRedo) event notifies your application that the
Redo operation is about to start (CTRL + Y)
ChartEndChanging(exRedo) event notifies your application that the
Redo operation has been completed (CTRL + Y)
The following sample lists the actions that the control performs once
the user presses the CTRL + Z ( Undo operation ) or CTRL + Y ( Redo
operation )
Private Sub G2antt1_ChartStartChanging(ByVal Operation As EXG2ANTTLibCtl.BarOperationEnum)
If (exUndo = Operation) Then
Debug.Print "Undo"
Debug.Print G2antt1.Chart.UndoListAction(, 0)
Else
If (exRedo = Operation) Then
Debug.Print "Redo"
Debug.Print G2antt1.Chart.RedoListAction(, 0)
End If
End If
End Sub
The sample prints the actions to be performed by Undo/Redo before it
happens ( ChartStartChanging event notifies your application before action
itself ).
Now, let's say that your application saves each bar to a record into a
table, while the links to another table, so we need to synchronize these
records too when the user does Undo/Redo operations. By Undo/Redo
operations, bars or links on the chart can be recreated / removed, so the
ChartStartChanging(exUndo/ExRedo) and ChartEndChanging(exUndo/ExRedo)
events should be used to synchronize these operations with your tables.
The following samples, uses the bar's Items.ItemBar(exBarData) and link's
Items.Link(exLinkUserData) properties to save the values of the associated
record, just before removing the object by a Undo/Redo operation.
First, we need to add the ChartStartChanging and ChartEndChanging to catch the Undo/Redo events like follows:
Private Sub exg2antt_ChartStartChanging(ByVal Operation As Long)
Select Case Operation
Case exUndo
UndoRedoChange exg2antt.Object, Operation, True
Case exRedo
UndoRedoChange exg2antt.Object, Operation, True
End Select
End Sub
Private Sub exg2antt_ChartEndChanging(ByVal Operation As Long)
Select Case Operation
Case exUndo
UndoRedoChange exg2antt.Object, Operation, False
Case exRedo
UndoRedoChange exg2antt.Object, Operation, False
End Select
End Sub
Next, the UndoRedoChange procedure, calls popRecordToVariant for objects that are going to be removed from the chart, and calls pushVariantToRecord for those who are going to be added to the chart
Public Sub UndoRedoChange(ByRef g As EXG2ANTTLib.G2antt, ByVal nOperation As EXG2ANTTLib.BarOperationEnum, ByVal bStart As Boolean)
Dim c As Variant, sBarKey As String, sLinkKey As String
Select Case nOperation
Case exUndo
If (bStart) Then
' Collects the exChartUndoRedoAddBar(2) - "AddBar;ITEM;KEY;NAME;STARTDATE;ENDDATE".
For Each c In Split(g.Chart.UndoListAction(2, 0), vbCrLf)
sBarKey = Split(c, ";")(2)
g.Items.ItemBar(Split(c, ";")(1), sBarKey, exBarData) = popRecordToVariant(getBarsTable(), "BarID = " & getBarID(sBarKey), True)
Next
' Collects the exChartUndoRedoAddLink(7) - "AddLink;LINKKEY;STARTITEM;STARTKEY;ENDITEM;ENDKEY"
For Each c In Split(g.Chart.UndoListAction(7, 0), vbCrLf)
sLinkKey = Split(c, ";")(1)
g.Items.Link(sLinkKey, exLinkUserData) = popRecordToVariant(getLinksTable(), "LinkID = " & getLinkID(sLinkKey), True)
Next
Else
' Collects the exChartUndoRedoRemoveBar(3) - "RemoveBar;ITEM;KEY;NAME"
For Each c In Split(g.Chart.RedoListAction(3, 0), vbCrLf)
pushVariantToRecord getBarsTable(), g.Items.ItemBar(Split(c, ";")(1), Split(c, ";")(2), exBarData)
Next
' Collects the exChartUndoRedoRemoveLink(8) - "RemoveLink;LINKKEY"
For Each c In Split(g.Chart.RedoListAction(8, 0), vbCrLf)
pushVariantToRecord getLinksTable()(), g.Items.Link(Split(c, ";")(1), exLinkUserData)
Next
End If
Case exRedo
If (bStart) Then
' Collects the exChartUndoRedoRemoveBar(3) - "RemoveBar;ITEM;KEY;NAME"
For Each c In Split(g.Chart.RedoListAction(3, 0), vbCrLf)
sBarKey = Split(c, ";")(2)
g.Items.ItemBar(Split(c, ";")(1), sBarKey, exBarData) = popRecordToVariant(getBarsTable(), "BarID = " & getBarID(sBarKey), True)
Next
' Collects the exChartUndoRedoRemoveLink(8) - "RemoveLink;LINKKEY"
For Each c In Split(g.Chart.RedoListAction(8, 0), vbCrLf)
sLinkKey = Split(c, ";")(1)
g.Items.Link(sLinkKey, exLinkUserData) = popRecordToVariant(getLinksTable(), "LinkID = " & getLinkID(sLinkKey), True)
Next
Else
' Collects the exChartUndoRedoAddBar(2) - "AddBar;ITEM;KEY;NAME;STARTDATE;ENDDATE"
For Each c In Split(g.Chart.UndoListAction(2, 0), vbCrLf)
pushVariantToRecord getBarsTable(), g.Items.ItemBar(Split(c, ";")(1), Split(c, ";")(2), exBarData)
Next
' Collects the exChartUndoRedoAddLink(7) - "AddLink;LINKKEY;STARTITEM;STARTKEY;ENDITEM;ENDKEY"
For Each c In Split(g.Chart.UndoListAction(7, 0), vbCrLf)
pushVariantToRecord getLinksTable()(), g.Items.Link(Split(c, ";")(1), exLinkUserData)
Next
End If
End Select
End Sub
where:
The popRecordToVariant procedure, finds a record based on the criteria, saves the fields to a Variant, and deleted it
Public Function popRecordToVariant(ByVal sTable As String, ByVal sCriteria As String, ByVal bDelete As Boolean) As Variant
Dim vtResult As Variant
With CurrentDb.OpenRecordset(sTable, dbOpenDynaset)
.FindFirst sCriteria
If Not .NoMatch Then
Dim bBookMark As Variant
bBookMark = .Bookmark
vtResult = .GetRows(1)
.Bookmark = bBookMark
If (bDelete) Then
.Delete
End If
End If
End With
popRecordToVariant = vtResult
End Function
The pushVariantToRecord procedure, gets the previously Variant ( built by the popRecordToVariant ), and adds a new record with specified values.
Public Function pushVariantToRecord(ByVal sTable As String, ByVal sVariant As Variant)
If (IsArray(sVariant)) Then
Dim i As Long, u As Long
With CurrentDb.OpenRecordset(sTable, dbOpenDynaset)
.AddNew
u = UBound(sVariant)
For i = 0 To u
.Fields(i).Value = sVariant(i, 0)
Next
.Update
End With
End If
End Function
getBarsTable() function gets the name of the Table where the bars of
the chart are being saved. The getBarID() function converts the bar's key to a bar's
identifier saved to the BarID field of the bars table. It could returns the bar's key as well.
getLinksTable() function gets the name of the Table where the links
of the chart are being saved. The getLinkID() function converts the
link's key to a link's identifier saved to the LinkID field of the
links table. It could returns the link's key as well.
The same technique should be used for any object being removed from the
chart using the Delete key.
The Chart.NonworkingHours property specifies the hours to show a different
pattern / background color. Each hour is identified by a bit in the
Chart.NonworkingHours property. The following function gets the value for
the Chart.NonworkingHours property, giving start and end day shift hours:
Public Function getNonworkingHours(ByVal startTime As Date, ByVal endTime As Date) As Long
Dim nNonworkingHours As Long, d As Double, n As Long, i As Long, dHour As Double, dSec As Double
nNonworkingHours = 0
dHour = 1 / 24
dSec = dHour / 60 / 60
d = 0
n = 1
For i = 1 To 24
If (((d < startTime) And (Abs(d - startTime) > dSec)) Or ((d > endTime) And (Abs(d - endTime) > dSec))) Then
nNonworkingHours = nNonworkingHours + n
End If
n = n * 2
d = d + dHour
Next
getNonworkingHours = nNonworkingHours
End Function
The getNonworkingHours function, takes the start / end time ( values
between 0 and 1 ), and returns the value to specify for the
Chart.NonworkingHours property. For instance, the G2antt1.Chart.NonworkingHours = getNonworkingHours(#6:00:00 AM#, #6:00:00 PM#)
specifies working hours between 06:00 AM and 06:00 PM (inclusive).
Definitely. The AddBar
method can be used to add multiple bars to the same item or row. The Key
parameter must be unique for each added bar, inside the item, so multiple bars
can be displayed and accessed later. The Key is per item, not really required
an unique key for all items in the chart. For instance, you can have inside
one item two bars with the keys "K1" and "K2", and
other two bars in another row with the same keys. The Key is user responsibility
and it is uses to identify a bar inside the item.
Yes, it is possible. Please check the ResizeUnitScale
and ResizeUnitCount
properties of the Chart object that allow to specify a different resizing
time-scale unit when the user resizes, moves or drags bars. The UnitScale
property of the Chart determines the the unit scale being displayed in the
chart. In this particular case, the Chart.UnitScale property is exHour, so the
Chart.ResizeUnitScale property should be exMinute, and the Chart.ResizeUnitCount
property should be 5, so the user will be able to move, resizes or drag up to
5 minutes.
Currently, the control's owner-draw feature allows you to customize the visual-appearance for bars/tasks or control's histogram part.
The control provides the following events:
BeforeDrawPart,
occurs just before drawing a part of the control. For instance, you need to
customize the part's background
AfterDrawPart,
occurs right after drawing the part of the control. For instance, you need
to customize the part's foreground
Shortly, you can customize the drawing of control's part before and after
default-drawing.
For instance, let's say that you need to specify a different background
color, for "task" bars, while still keeping the bar's pattern color,
which is specified by the bar's exBarColor property. In order to perform
owner-draw for bars you need:
defines a new type of bar called "OwnerDraw", which can be a new
bar or a copy of any existing bars (only bars of "OwnerDraw" type
fires BeforeDrawPart and AfterDrawPart events when they require to be
painted)
overrides the BeforeDrawPart and / or AfterDrawPart events
During the BeforeDrawPart and AfterDrawPart events, while Part event
parameter is exOwnerDrawBar, the control's DrawPartItem and DrawPartKey provides
the handle of the item and the key of the bar being drawn. You can use the
Items.ItemBar(DrawPartItem, DrawPartKey, BarProperty) property to access any
property related to the bar being painted. In the same manner you can use the
Items.CellValue/Items.CellCaption properties to access any value/caption from
the list/columns part of the control.
The following code defines the "OwnerDraw" bar-type:
With .Chart.Bars.Add("OwnerDraw")
.Color = Color.DodgerBlue
End With
The following code converts all existing bars of "OwnerDraw" type:
With .Items
.set_ItemBar(0, "<*>", exontrol.EXG2ANTTLib.ItemBarPropertyEnum.exBarName, "OwnerDraw")
End With
The following VB/NET sample (/NET Assembly) shows how you can divide a bar in three colors with dynamic percentages (percentage of colors can be different for each bar):
Private Sub exg2antt1_AfterDrawPart(ByVal sender As Object, ByVal Part As exontrol.EXG2ANTTLib.DrawPartEnum, ByVal G As System.Drawing.Graphics, ByVal Rect As System.Drawing.Rectangle) Handles exg2antt1.AfterDrawPart
Rect.Inflate(-1, -1)
Dim left As Rectangle = New Rectangle(Rect.Location, Rect.Size), right As Rectangle = New Rectangle(Rect.Location, Rect.Size)
left.Width = left.Width / (2 + exg2antt1.DrawPartItem Mod 3)
right.Width = left.Width / 2
right.X = Rect.Right - right.Width
Using fmt As StringFormat = New StringFormat(StringFormatFlags.NoClip Or StringFormatFlags.NoWrap)
fmt.Trimming = StringTrimming.None
fmt.LineAlignment = StringAlignment.Center
G.FillRectangle(Brushes.Yellow, left)
G.DrawString(String.Format("{0:0}", 100 * (left.Width / CDbl(Rect.Width))) + "%", exg2antt1.Font, Brushes.Black, left, fmt)
G.FillRectangle(Brushes.Lime, right)
G.DrawString(String.Format("{0:0}", 100 * (right.Width / CDbl(Rect.Width))) + "%", exg2antt1.Font, Brushes.Black, right, fmt)
End Using
End Sub
With no BeforeDrawPart handler, the control shows as:
The following code defines the "OwnerDraw" bar-type:
With .Chart.Bars.Add("OwnerDraw")
.Color = Color.Black
.Pattern = exontrol.EXG2ANTTLib.PatternEnum.exPatternBDiagonal
End With
The following sample adds a bar of "OwnerDraw" type:
With .Items
.AddBar(.AddItem("new"), "OwnerDraw", #1/1/1994#, #1/12/1994#)
End With
With the next BeforeDrawPart handler it shows as follows:
Private Sub Exg2antt1_BeforeDrawPart(ByVal sender As System.Object, ByVal Part As exontrol.EXG2ANTTLib.DrawPartEnum, ByVal G As System.Drawing.Graphics, ByRef Rect As System.Drawing.Rectangle, ByRef Cancel As System.Boolean) Handles Exg2antt1.BeforeDrawPart
If (Part = exontrol.EXG2ANTTLib.DrawPartEnum.exOwnerDrawBar) Then
G.FillRectangle(Brushes.Yellow, Rect)
End If
End Sub
With the next BeforeDrawPart handler it shows as follows:
Private Sub Exg2antt1_BeforeDrawPart(ByVal sender As System.Object, ByVal Part As exontrol.EXG2ANTTLib.DrawPartEnum, ByVal G As System.Drawing.Graphics, ByRef Rect As System.Drawing.Rectangle, ByRef Cancel As System.Boolean) Handles Exg2antt1.BeforeDrawPart
If (Part = exontrol.EXG2ANTTLib.DrawPartEnum.exOwnerDrawBar) Then
With Exg2antt1.Items
G.FillRectangle(New SolidBrush(Color.FromArgb(255, (.get_CellValue(Exg2antt1.DrawPartItem, "EmployeeID") / 6 * 255) Mod 255, 0)), Rect)
End With
End If
End Sub
If your owner-bars require to display percents, you need to re-define a new type of bar which includes the "Progress" as in the following sample:
With .Chart.Bars.Add("OwnerDraw%Progress")
.Shortcut = "OwnerProgress"
End With
The following sample adds a bar of "OwnerProgress" type, with a percent of 75%:
With .Items
Dim h As Integer = .AddItem("new")
.AddBar(h, "OwnerProgress", #1/1/1994#, #1/12/1994#, "K1")
.set_ItemBar(h, "K1", exontrol.EXG2ANTTLib.ItemBarPropertyEnum.exBarPercent100, 75)
End With
The control fires OffsetChanged(false) event as soon as the user vertically scrolls the control. The ScrollToolTip property specifies the tooltip to show once the user clicks and drags the scrollbar's thumb.
The following VB code shows the caption of the first visible item as soon as user drags the vertical thumb:
Private Sub G2antt1_OffsetChanged(ByVal Horizontal As Boolean, ByVal NewVal As Long)
If (Not Horizontal) Then
With G2antt1
.ScrollToolTip(exVScroll) = .Items.CellCaption(.Items.FirstVisibleItem, 0)
End With
End If
End Sub
Usually it is happen when you load data from a record set. When you call
CellValue() = rs("Field") the CellValue property holds a reference to a Field
object not to the field's value. In order to fix that you have to pass the
rs("Field").Value to the CellValue property as shown in the following sample:
The following code enumerates the records within a recordset, and adds a new item for each record found:
rs.MoveFirst
While Not rs.EOF()
.AddItem rs(0)
rs.MoveNext
Wend
The list shows nothing, so you need to use a code as follows:
rs.MoveFirst
While Not rs.EOF()
.AddItem rs(0).Value
rs.MoveNext
Wend
In conclusion, the rs("Field") returns a reference to an object of Field type, while rs("Field").Value returns the value of the field itself.
In order to provide context-menu feature for the control, you need to download and install the eXContextMenu (A context menu is a menu in a graphical user interface (GUI) that appears upon user interaction, such as a right-click mouse operation).
The following sample show how you can display the column's check-box, change
the column's background/foreground color using the context-menu. The idea is:
creates and initializes the context menu
handle the control's RClick event to store the column from point, and
display the context menu
handle the context-menu's Event event to apply the changes of the
context-menu to the column being previously stored
The control provides the following functions to get the column from point:
ColumnFromPoint property, retrieves the index of the column from point, while cursor hovers the control's header
ItemFromPoint property, retrieves the item from the cursor, including the column, while cursor hovers the control's list section
The following VB sample declares and initalizes the context-menu:
Private WithEvents excontext As EXCONTEXTMENULib.ExContextMenu
Private Sub Form_Load()
Set excontext = New EXCONTEXTMENULib.ExContextMenu
With excontext
.Appearance = SingleBorder
.BackColor = &HF0F0F0
.Items.ToString = "CheckBox[chk=0][show=-1][id=5][ttp=shows or hides the column's check-box],[sep][id=0],Background[spchk][chk=0][group=0x03][id=10][show=-1][ttp=defines the column's background]([edittype=0x01][editwidth=-64][edit=F0F0F0][id=11]),Foreground[spchk][chk=0][group=0x03][id=20][show=-1][ttp=defines the column's foreground]([edittype=0x01][editwidth=-64][edit=0000FF][id=21])"
End With
End Sub
The ToString property of the Items object has been generated using the eXContextMenu's WYSWYG Designer. The ToString property defines three items named CheckBox, Background and Foreground, that shows or hides the column's checkbox, or change the column's background/foreground colors.
The following VB function gets the column from the point:
Private Function getColumnFromPoint() As EXG2ANTTLibCtl.Column
With G2antt1
Dim colIndex As Long
colIndex = .ColumnFromPoint(-1, -1) ' gets the column from the cursor while it hovers the header only
If (c Is Nothing) Then
Dim i As Long, hit As EXG2ANTTLibCtl.HitTestInfoEnum
i = G2antt1.ItemFromPoint(-1, -1, colIndex, hit) ' gets the column from the cursor while it hovers the list-portion
End If
Set getColumnFromPoint = G2antt1.Columns.Item(colIndex)
End With
End Function
The following VB sample displays the context menu once the user right-clicks the control:
Private c As EXG2ANTTLibCtl.Column
Private Sub G2antt1_RClick()
' Gets the column from the cursor
Set c = getColumnFromPoint()
If Not c Is Nothing Then
With excontext
' Initalizes the "CheckBox", "Background" and "Foreground" with the values of the column from the point
.Item(5).Checked = c.Def(exCellHasCheckBox)
.Item(10).Checked = c.Def(exCellBackColor)
.Item(11).EditValue = IIf(.Item(10).Checked, Hex(c.Def(exCellBackColor)), "")
.Item(20).Checked = c.Def(exCellForeColor)
.Item(21).EditValue = IIf(.Item(20).Checked, Hex(c.Def(exCellForeColor)), "")
' Shows the context-menu
.Select
End With
End If
Set c = Nothing
End Sub
Finally, what we need is to apply the context-menu changes to the control, as in the following VB sample (implement the Event event of the eXContextMenu):
Private Sub excontext_Event(ByVal eventID As Long)
If Not c Is Nothing Then
' Changes the properties of the column according with the context-menu
With G2antt1
.BeginUpdate
c.Def(exCellHasCheckBox) = excontext.Item(5).Checked
c.Def(exCellBackColor) = IIf(excontext.Item(10).Checked, .ExecuteTemplate("0x" + excontext.Item(11).EditValue), 0) ' Converts hexa to decimal
c.Def(exCellForeColor) = IIf(excontext.Item(20).Checked, .ExecuteTemplate("0x" + excontext.Item(21).EditValue), 0) ' Converts hexa to decimal
.EndUpdate
End With
End If
End Sub
And the entire sample is:
Private WithEvents excontext As EXCONTEXTMENULib.ExContextMenu
Private c As EXG2ANTTLibCtl.Column
Private Sub Form_Load()
Set excontext = New EXCONTEXTMENULib.ExContextMenu
With excontext
.Appearance = SingleBorder
.BackColor = &HF0F0F0
.Items.ToString = "CheckBox[chk=0][show=-1][id=5][ttp=shows or hides the column's check-box],[sep][id=0],Background[spchk][chk=0][group=0x03][id=10][show=-1][ttp=defines the column's background]([edittype=0x01][editwidth=-64][edit=F0F0F0][id=11]),Foreground[spchk][chk=0][group=0x03][id=20][show=-1][ttp=defines the column's foreground]([edittype=0x01][editwidth=-64][edit=0000FF][id=21])"
End With
With G2antt1
.BeginUpdate
.SelBackMode = exTransparent
.HeaderAppearance = Flat
.LinesAtRoot = exLinesAtRoot
.DrawGridLines = exVLines
.GridLineStyle = &H200
.HeaderHeight = 22
.Background(exCursorHoverColumn) = -1
.Columns.Add("Tasks").PartialCheck = True
With .Columns.Add("Pos")
.FormatColumn = "1 rpos ''"
.Position = 0
.AllowSizing = False
.Width = 48
.PartialCheck = True
End With
.BackColorLevelHeader = .BackColor
With .Chart
.FirstVisibleDate = #9/20/2006#
.ShowCollapsedBars = True
.LevelCount = 2
.PaneWidth(0) = 196
End With
With .Items
h = .AddItem("Project 1")
h1 = .InsertItem(h, , "Task 1")
.AddBar h1, "Task", #9/21/2006#, #9/23/2006#, "A"
h2 = .InsertItem(h, , "Task 2")
.AddBar h2, "Task", #9/24/2006#, #9/26/2006#, "B"
h3 = .InsertItem(h, , "Task 3")
.AddBar h3, "Task", #9/27/2006#, #9/29/2006#, "C"
h = .AddItem("Project 2")
h1 = .InsertItem(h, , "Task 1")
.AddBar h1, "Task", #9/21/2006#, #9/23/2006#, "A"
h2 = .InsertItem(h, , "Task 2")
.AddBar h2, "Task", #9/24/2006#, #9/26/2006#, "B"
h3 = .InsertItem(h, , "Task 3")
.AddBar h3, "Task", #9/27/2006#, #9/29/2006#, "C"
.ExpandItem(h) = True
End With
.EndUpdate
End With
End Sub
Private Function getColumnFromPoint() As EXG2ANTTLibCtl.Column
With G2antt1
Dim colIndex As Long
colIndex = .ColumnFromPoint(-1, -1) ' gets the column from the cursor while it hovers the header only
If (c Is Nothing) Then
Dim i As Long, hit As EXG2ANTTLibCtl.HitTestInfoEnum
i = G2antt1.ItemFromPoint(-1, -1, colIndex, hit) ' gets the column from the cursor while it hovers the list-portion
End If
Set getColumnFromPoint = G2antt1.Columns.Item(colIndex)
End With
End Function
Private Sub G2antt1_RClick()
' Gets the column from the cursor
Set c = getColumnFromPoint()
If Not c Is Nothing Then
With excontext
' Initalizes the "CheckBox", "Background" and "Foreground" with the values of the column from the point
.Item(5).Checked = c.Def(exCellHasCheckBox)
.Item(10).Checked = c.Def(exCellBackColor)
.Item(11).EditValue = IIf(.Item(10).Checked, Hex(c.Def(exCellBackColor)), "")
.Item(20).Checked = c.Def(exCellForeColor)
.Item(21).EditValue = IIf(.Item(20).Checked, Hex(c.Def(exCellForeColor)), "")
' Shows the context-menu
.Select
End With
End If
Set c = Nothing
End Sub
Private Sub excontext_Event(ByVal eventID As Long)
If Not c Is Nothing Then
' Changes the properties of the column according with the context-menu
With G2antt1
.BeginUpdate
c.Def(exCellHasCheckBox) = excontext.Item(5).Checked
c.Def(exCellBackColor) = IIf(excontext.Item(10).Checked, .ExecuteTemplate("0x" + excontext.Item(11).EditValue), 0) ' Converts hexa to decimal
c.Def(exCellForeColor) = IIf(excontext.Item(20).Checked, .ExecuteTemplate("0x" + excontext.Item(21).EditValue), 0) ' Converts hexa to decimal
.EndUpdate
End With
End If
End Sub
You need to insert the eXG2antt component to the form (in design mode) and add a reference for the "ExContextMenu 1.0 Type Library" to the project.
The name of the event is not available for the /NET version, when using the get_EventParam(-2) property. It is available for /COM version only. The EventParam property retrieves or sets a value that indicates the current's event parameter. The EventParam(-1) retrieves the number of the parameters of the current event. The EventParam(-2) retrieves informtion about the current event, including its name and parameters.
The list of identifiers for each event is:
-607, event MouseUp (Button as Integer, event Shift as Integer, event X as OLE_XPOS_PIXELS, event Y as OLE_YPOS_PIXELS)
-606, event MouseMove (Button as Integer, event Shift as Integer, event X as OLE_XPOS_PIXELS, event Y as OLE_YPOS_PIXELS)
-605, event MouseDown (Button as Integer, event Shift as Integer, event X as OLE_XPOS_PIXELS, event Y as OLE_YPOS_PIXELS)
-604, event KeyUp (KeyCode as Integer, event Shift as Integer
-603, event KeyPress (KeyAscii as Integer)
-602, event KeyDown (KeyCode as Integer, event Shift as Integer)
-601, event DblClick (Shift as Integer, event X as OLE_XPOS_PIXELS, event Y as OLE_YPOS_PIXELS)
-600, event event Click ()
1, event AddItem (Item as HITEM)
2, event RemoveItem (Item as HITEM)
3, event ColumnClick (Column as Column)
4, event CellImageClick (Item as HITEM, event ColIndex as Long)
5, event CellStateChanged (Item as HITEM, event ColIndex as Long)
6, event SelectionChanged ()
7, event AddColumn (Column as Column)
8, event RemoveColumn (Column as Column)
9, event OversizeChanged (Horizontal as Boolean, event NewVal as Long)
10, event OffsetChanged (Horizontal as Boolean, event NewVal as Long)
11, event RClick
15, event FormatColumn (Item as HITEM, event ColIndex as Long, event Value as Variant)
16, event BeforeExpandItem (Item as HITEM, event Cancel as Variant)
17, event AfterExpandItem (Item as HITEM)
18, event ItemOleEvent (Item as HITEM, event Ev as OleEvent)
19, event LayoutChanged()
20, event HyperLinkClick()
21, event FilterChange()
22, event ToolTip (Item as HITEM, event ColIndex as Long, event Visible as Boolean, event X as Long, event Y as Long, event CX as Long, event CY as Long)
24, event FilterChanging()
31, event AddGroupItem (Item as HITEM)
32, event CellStateChanging(Item as HITEM, event ColIndex as Long, event NewState as Long )
50, event DateChange ()
51, event ChartStartChanging(Operation as BarOperationEnum)
52, event ChartEndChanging (Operation as BarOperationEnum)
53, event InsideZoom (DateTime as Date)
54, event BeforeDrawPart (Part as DrawPartEnum, event hDC as Long, event X as Long, event Y as Long, event Width as Long, event Height as Long, event Cancel as Boolean)
55, event AfterDrawPart (Part as DrawPartEnum, event hDC as Long, event X as Long, event Y as Long, event Width as Long, event Height as Long)
100, event Sort ()
101, event Edit (Item as HITEM, event ColIndex as Long, event Cancel as Boolean)
102, event ButtonClick (Item as HITEM, event ColIndex as Long, event Key as Variant)
103, event Change (Item as HITEM, event ColIndex as Long, event NewValue as Variant)
104, event Error (Error as Long, event Description as String)
105, event ValidateValue (Item as HITEM, event ColIndex as Long, event NewValue as Variant, event Cancel as Boolean)
106, event UserEditorOpen (Object as Object, event Item as HITEM, event ColIndex as Long)
107, event UserEditorClose (Object as Object, event Item as HITEM, event ColIndex as Long)
108, event UserEditorOleEvent (Object as Object, event Ev as OleEvent, event CloseEditor as Boolean, event Item as HITEM, event ColIndex as Long)
109, event FocusChanged()
110, event EditOpen()
111, event EditClose()
120, event BarResize (Item as HITEM, event Key as Variant)
121, event CreateBar (Item as HITEM, event DateStart as Date, event DateEnd as Date)
122, event AddLink (LinkKey as String)
123, event ChartSelectionChanged ()
124, event DateTimeChanged (DateTime as Date)
125, event BarParentChange (Item as HITEM, event Key as Variant, event NewItem as HITEM, event Cancel as Boolean)
128, event AllowLink (StartItem as HITEM, event StartBarKey as Variant, event EndItem as HITEM, event EndBarKey as Variant, event LinkKey as Variant, event Cancel as Boolean)
129, event BarResizing (Item as HITEM, event Key as Variant)
130, event AllowAutoDrag(Item as HITEM, event NewParent as HITEM, event InsertA as HITEM, event InsertB as HITEM, event Cancel as Boolean)
200, event ScrollButtonClick (ScrollBar as ScrollBarEnum, event ScrollPart as ScrollPartEnum)
450, event AnchorClick (AnchorID as String, event Options as String)
The information the get_EventParam(-2) property returns using the /NET version, shows as:
The following solution uses the ShowToolTip method during the MouseMove to display the tooltip while hovering the item-bar (the advantage of this method is that the tooltip remains while cursor hovers the item-bar):
Private Sub G2antt1_MouseMove(Button As Integer, Shift As Integer, X As Single, Y As Single)
Dim i As HITEM, c As Long, hit As HitTestInfoEnum, bar As Variant
With G2antt1
bar = .Chart.BarFromPoint(-1, -1)
If Not (IsEmpty(bar)) Then
i = .ItemFromPoint(-1, -1, c, hit)
.ShowToolTip .Items.CellCaption(i, 0) + " <b>" + bar
End If
End With
End Sub
If computing the bar's tooltip is complex and time consuming, you can use the ItemBar(exBarData) to store/restore the computed tooltip as in the following sample:
Private Sub G2antt1_MouseMove(Button As Integer, Shift As Integer, X As Single, Y As Single)
Dim i As HITEM, c As Long, hit As HitTestInfoEnum, bar As Variant, sToolTip As String
With G2antt1
bar = .Chart.BarFromPoint(-1, -1)
If Not (IsEmpty(bar)) Then
i = .ItemFromPoint(-1, -1, c, hit)
sToolTip = .Items.ItemBar(i, bar, exBarData)
If Len(sToolTip) = 0 Then
sToolTip = .Items.CellCaption(i, 0) + " <b>" + bar
.Items.ItemBar(i, bar, exBarData) = sToolTip
End If
.ShowToolTip sToolTip
End If
End With
End Sub
The solution is using a timer combined with ShowToolTip method, as in the following sample (the disadvantage of this method is that the tooltip is hidden as soon as the cursor is moved):
Private Sub Form_Load()
With Timer1
.Interval = G2antt1.ToolTipDelay / 2
.Enabled = False
End With
End Sub
Private Sub G2antt1_MouseMove(Button As Integer, Shift As Integer, X As Single, Y As Single)
Timer1.Enabled = False ' !!! required so the timer is first stopped and if necessary started again
With G2antt1.Chart
Timer1.Enabled = .DateFromPoint(-1, -1) And .LevelFromPoint(-1, -1) < 0 ' enables the timer only if the cursor hovers the chart section
End With
End Sub
Private Sub Timer1_Timer()
Timer1.Enabled = False ' !!! required to stop the timer
G2antt1.ShowToolTip "Show this tooltip", "", 0, "+8", "+8"
End Sub
The sample re-starts the timer once you move the mouse over the chart-section of the control. The ShowToolTip() method is called when timer elapsed to actually show the tooltip.
The following /NET sample calls the ShowToolTip during the timer's handler:
Private Sub Form1_Load(ByVal sender As System.Object, ByVal e As System.EventArgs) Handles MyBase.Load
With Timer1
.Interval = Exg2antt1.ToolTipDelay / 2
.Enabled = False
End With
End Sub
Private Sub Exg2antt1_MouseMoveEvent(ByVal sender As Object, ByVal Button As Short, ByVal Shift As Short, ByVal X As Integer, ByVal Y As Integer) Handles Exg2antt1.MouseMoveEvent
Timer1.Enabled = False ' !!! required so the timer is first stopped and if necessary started again
With Exg2antt1.Chart
Timer1.Enabled = .get_DateFromPoint(-1, -1) <> Date.FromOADate(0) And .get_LevelFromPoint(-1, -1) < 0 ' enables the timer only if the cursor hovers the chart section
End With
End Sub
Private Sub Timer1_Tick(ByVal sender As System.Object, ByVal e As System.EventArgs) Handles Timer1.Tick
Timer1.Enabled = False ' !!! required to stop the timer
Exg2antt1.ShowToolTip("Show this tooltip", "", 0, "+8", "+8")
End Sub
The solution is using the GroupBars method (of Items object) as in the following sample:
With G2antt1
.BeginUpdate
.Columns.Add "Task"
With .Chart
.FirstVisibleDate = #1/1/2001#
.PaneWidth(False) = 96
End With
With .Items
h1 = .AddItem("Machine 2")
.AddBar h1, "Task", #1/5/2001#, #1/7/2001#, "T1"
.ItemBar(h1, "", exBarHAlignCaption) = 18
.AddBar h1, "Task", #1/3/2001#, #1/5/2001#, "T2"
.ItemBar(h1, "T2", exBarColor) = 255
.GroupBars h1, "T1", True, h1, "T2", False, exPreserveBarLength Or exLimitInterval, 0
End With
.EndUpdate
End With
The sample adds and groups two item-bars. If one bar gets moved horizontally (different date and time) the other is moved as well.
If you need to let bars to move from an item to another, the exBarCanMoveToAnother property for the bars must be set on True. To update the item's parent for both bars you need to handle the BarParentChange event as in the following sample:
G2antt1.Items.ItemBar(h1, "<T*>", exBarCanMoveToAnother) = True ' allow T* bars of h1 item to change its parent-item
' BarParentChange event - Occurs just before moving a bar from current item to another item.
Private Sub G2antt1_BarParentChange(ByVal Item As EXG2ANTTLibCtl.HITEM, ByVal Key As Variant, ByVal NewItem As EXG2ANTTLibCtl.HITEM, Cancel As Boolean)
nBarParentChange = nBarParentChange + 1
If (nBarParentChange = 1) Then
G2antt1.Items.ItemBar(Item, "<T*>", exBarParent) = NewItem
End If
nBarParentChange = nBarParentChange - 1
End Sub
The sample changes the exBarCanMoveToAnother property for T* bars of h1 item and updates the item-parent for T* bars at once once the BarParentChange event occurs.
The OnResizeControl property specifies the actions the control takes once the user resizes the control, moves the vertical or the horizontal splitter.
For instance, if the OnResizeControl property is exResizeChart, the chart gets resized once the control gets resized, but the control's list may gets smaller and its width gets not restored once the control's width is restored.
The solution is to set the Chart.PaneWidth(False) to original/changed value once the control/form gets resized, like in the following sample:
Dim w As Long
Private Sub Form_Load()
w = G2antt1.Chart.PaneWidth(False)
End Sub
Private Sub Form_Resize()
On Error Resume Next
With G2antt1
.Width = ScaleWidth - 2 * .Left
.Height = ScaleHeight - 2 * .Top
.Chart.PaneWidth(False) = w
End With
End Sub
Private Sub G2antt1_ChartEndChanging(ByVal Operation As EXG2ANTTLibCtl.BarOperationEnum)
If (Operation = exVSplitterChange) Then
w = G2antt1.Chart.PaneWidth(False)
End If
End Sub
The SelectItem property selects the item giving its handle.
The focused item changes immediately when a new item is selected. The FocusItem property gets the handle of the focused item.
The FocusColumnIndex property changes the focused column.
The SetFocus method is used to move the focus to a specific control within a form. This means that the specified control becomes the active control, and any input from the keyboard will be directed to that control.
The cell's editor automatically opens when the control gains focus, a new cell is selected, and the AutoEdit property is set to True. If the AutoEdit property is set to False, you can use the Edit method to edit the focused cell.
The following VB sample sets the focus on the cell in the first column of the second row (AutoEdit property is True):
With G2antt1
With .Items
.SelectItem(.ItemByIndex(1)) = True
End With
.FocusColumnIndex = 1
.SetFocus
End With
The following VB sample sets the focus on the cell in the first column of the second row (AutoEdit property is False):
With G2antt1
With .Items
.SelectItem(.ItemByIndex(1)) = True
End With
.FocusColumnIndex = 1
.SetFocus
.Edit
End With
Here's a detailed explanation of the differences between handle, index, and position as they relate to items:
Position
DefinitionThe position of an item refers to its visual or logical order in a list or collection
Behavior
The position of an item can change dynamically, especially when operations like sorting, filtering, or reordering are applied
For example, if you sort a list alphabetically, the positions of the items will shift to reflect the new order
Use CasePosition is useful when you need to know where an item appears in a specific context (e.g., displaying items in a UI)
Index
DefinitionThe index of an item is a fixed identifier that represents its location in a collection or data structure (like an array or list)
Behavior
The index typically does not change unless the item is explicitly added, removed, or the structure of the collection is modified
Even if the item's position changes (e.g., due to sorting), its index remains the same
Use CaseIndexes are commonly used in programming to access or manipulate specific items in a collection.
Handle
DefinitionA handle is a unique identifier or reference to an item, often used internally by an application or system
Behavior
A handle remains consistent while the application is running, meaning it doesn't change during the session
However, it may not be the same the next time the application is started, as handles are often generated dynamically
Use CaseHandles are useful for managing items in memory or when working with systems that require unique, temporary references (e.g., file handles, database connections)
>
Imagine a list of items: [C, B, A]
Position: Initially, A is at position 2, B at 1, and C at 0. If sorted alphabetically, the positions become A at 0, B at 1, and C at 2.
Index: The index of C is 0, B is 1, and A is 2. These indexes remain the same regardless of sorting.
Handle: Each item might have a unique handle (e.g., 164029560 for C, 164034312 for B and 164030088 for A). These handles stay the same while the app runs but could change the next time the app starts
The control provides functions like:
ItemPosition(handle) retrieves or updates the position of an item within the children list. To iterate through items based on their position, you can use the FirstVisibleItem and NextVisibleItem methods.
ItemToIndex (handle), retrieves the index of item into Items collection given its handle.
ItemByIndex(index), retrieves the handle of the item given its index in Items collection.

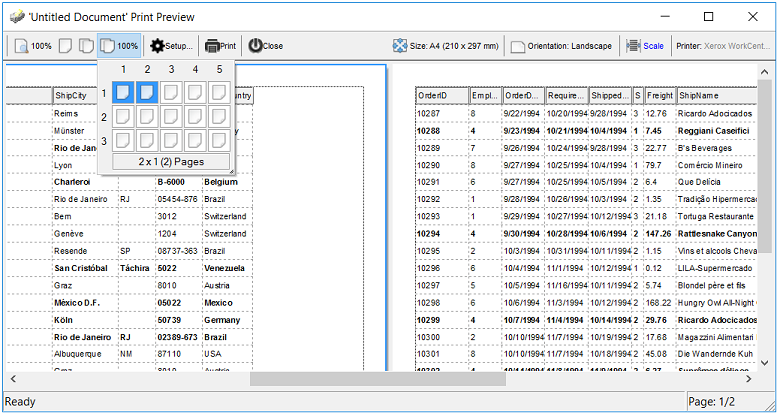


 ?
? ?
?